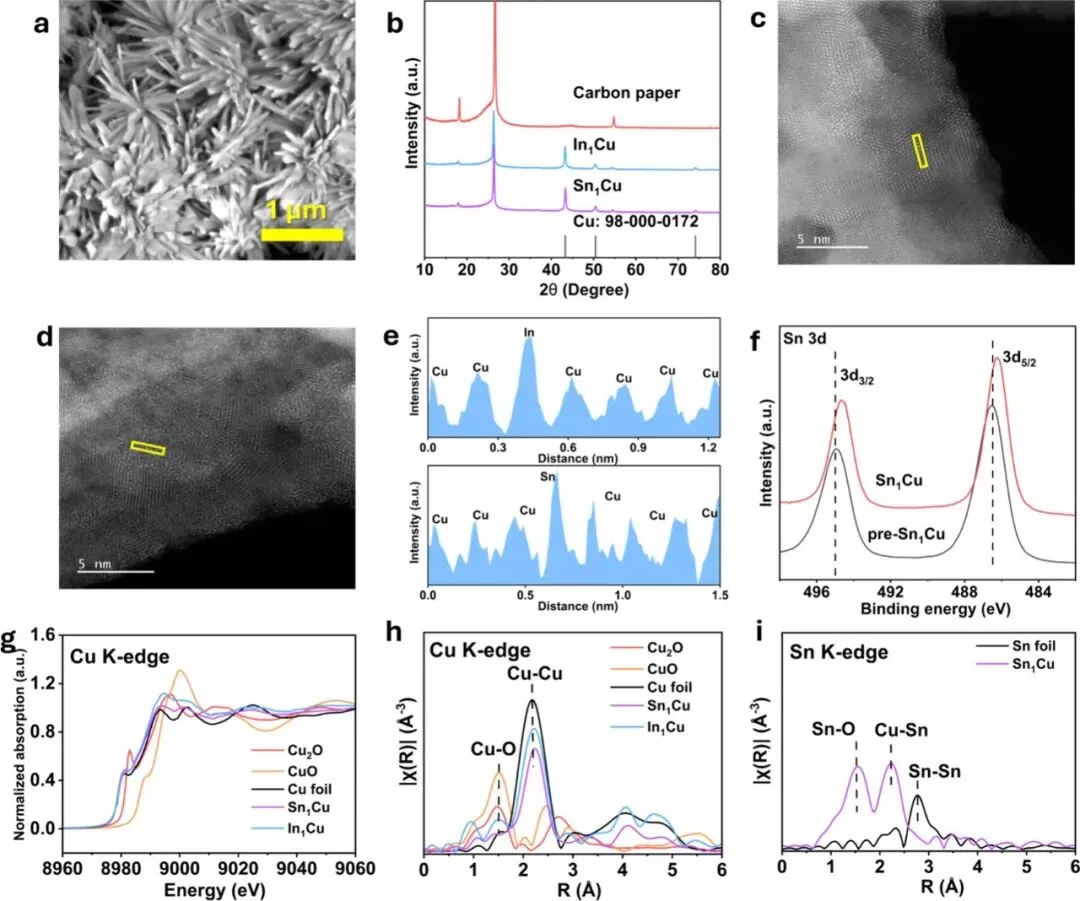
图1: 催化剂的合成与结构表征。(a) 纤维状前驱体及催化剂的扫描电镜(SEM)图像,(b) X射线衍射(XRD)图谱,(c-e) 球差校正透射电镜(TEM)及能谱(EDS)元素分布,(f) X射线光电子能谱(XPS),(g, h) Cu K-edge X射线吸收近边结构(XANES)及扩展X射线吸收精细结构(EXAFS)。
Figure 1: Structural characterizations of In1Cu and Sn1Cu. (a) SEM image of the Sn1Cu catalyst. (b) XRD patterns of Cu, In1Cu and Sn1Cu catalysts. (c-d) Aberration-corrected TEM of In1Cu (c) and Sn1Cu (d). (e) Line-intensity profiles of In1Cu and Sn1Cu as outlined in (c,d). (f) High-resolution Sn 3d XPS spectra of pre-Sn1Cu and Sn1Cu. (g) Cu K-edge XANES spectra of In1Cu and Sn1Cu, benchmarked by Cu foil, Cu2O and CuO. (h) FT-EXAFS spectra at Cu K-edge of In1Cu and Sn1Cu, benchmarked by Cu foil, Cu2O and CuO. (i) FT-EXAFS spectra at Sn K-edge of Sn1Cu, benchmarked by Sn foil. R, apparent radial distance.
图1展示了催化剂的微观结构与化学态。电镜图像证实了催化剂保持了纤维状形貌,且In或Sn元素在铜基底上实现了均匀的原子级分散。XPS结果显示In/Sn的引入改变了铜的电子结构。X射线吸收谱(XAS)进一步证实了在电化学还原后,铜物种主要以金属态(Cu⁰)存在,且In/Sn保持了高度分散状态,未形成明显的金属团簇,这为高温下的结构稳定性提供了基础。
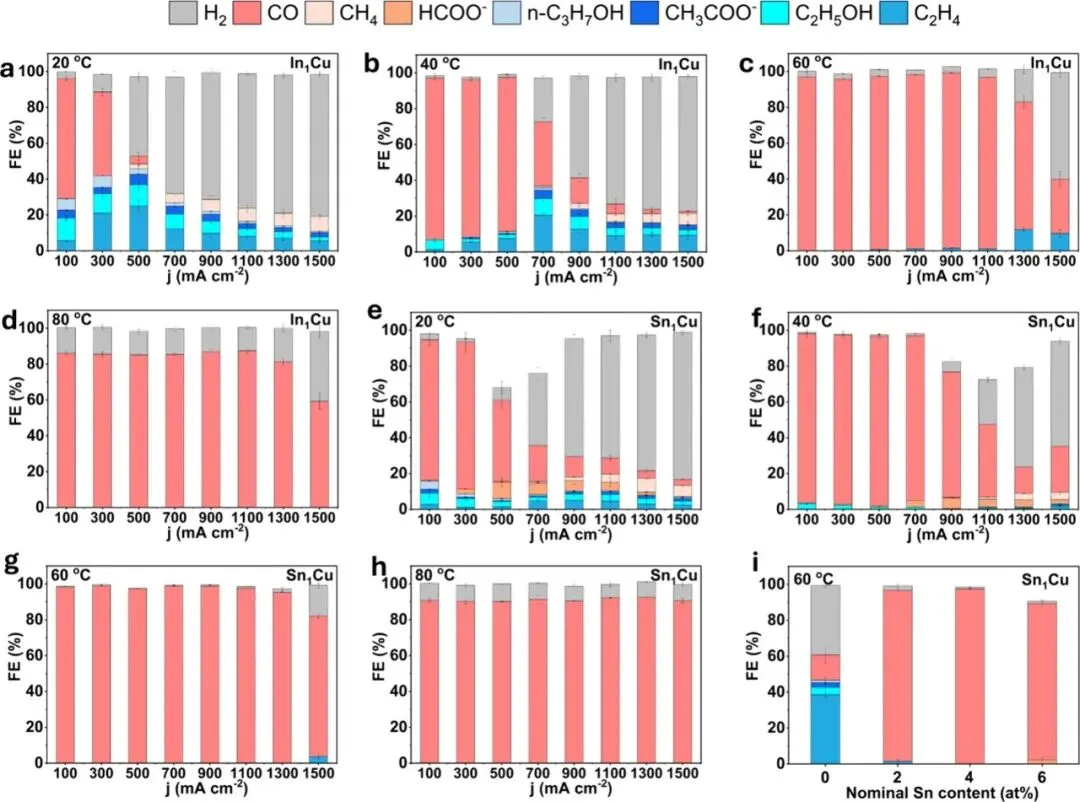
图2:温度依赖的电催化性能。(a-d) In₁Cu在不同温度(20-80°C)下的产物分布与法拉第效率,(e-h) Sn₁Cu在不同温度下的性能对比。
Figure 2:CO2 reduction performance of In1Cu and Sn1Cu under elevated temperatures. (a-d) Product distribution of CO2 reduction on In1Cu under 20 °C (a), 40 °C (b), 60 °C (c), 80 °C (d). (e-h) Product distribution of CO2 reduction on Sn1Cu under 20 °C (e), 40 °C (f), 60 °C (g), 80 °C (h). (i) FE for all products on Sn1Cu with different nominal Sn contents recorded at 1,100 mA cm–2 and 60 °C. The FE values are means, while error bars represent the standard deviation from three independent measurements (n = 3).
图2直观地展示了“越热越好”的奇特现象。与室温下(20°C)产物复杂(生成大量C₂⁺和H₂)不同,当温度升至60°C时,In₁Cu和Sn₁Cu的CO选择性均急剧提升至95%以上。值得注意的是,Sn₁Cu在60°C时表现尤为优异,在100至1,100 mA cm⁻²的宽电流密度范围内维持了98%的CO法拉第效率。相比之下,高温下析氢反应(HER)被显著抑制。
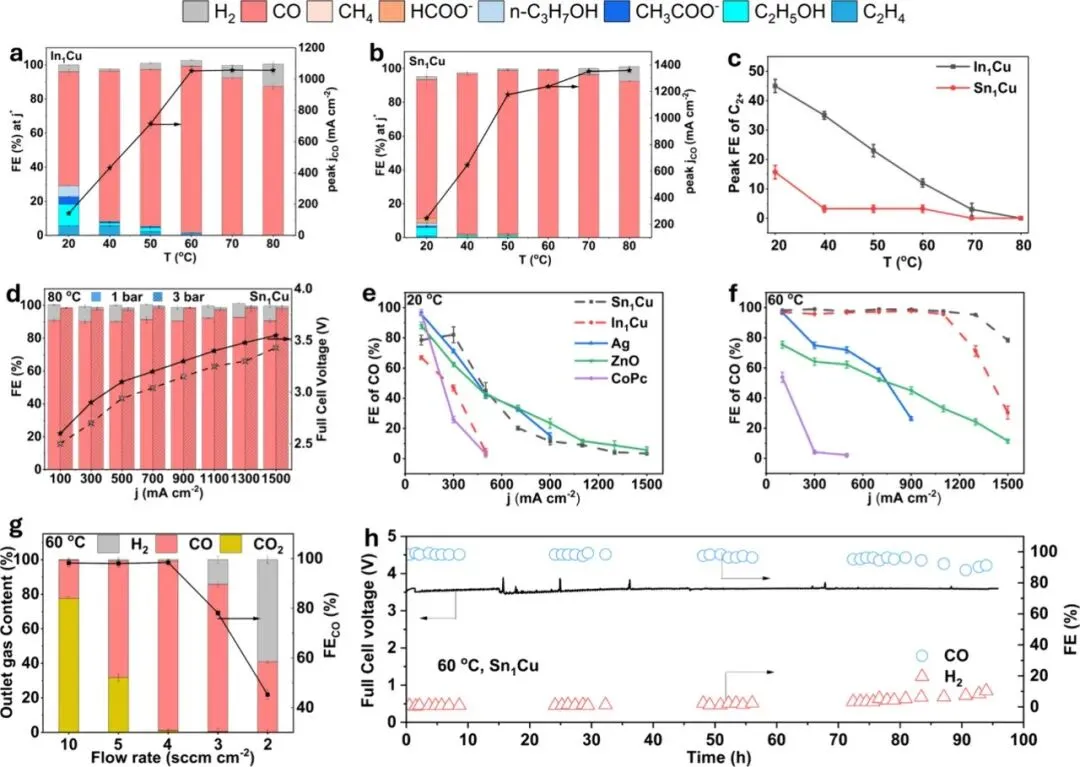
图3:性能对比与基准测试。(a, b) In₁Cu和Sn₁Cu在不同温度下的CO分电流密度(jCO),(c) C₂⁺产物的峰值选择性随温度变化,(d) 加压条件下的性能提升,(e, f) 与传统CO催化剂(Ag, ZnO, CoPc)在60°C下的直接对比。
Figure 3:Temperature effect on CO2 reduction performance of In1Cu and Sn1Cu. (a,b) Product distribution on In1Cu (a) and Sn1Cu (b) at j* under different temperatures, j* means the current density where FE of CO peaks. (c) Peak FE of C2+ for In1Cu and Sn1Cu at different temperatures. (d) Product distribution on Sn1Cu under different current densities at 80 °C under 1 and 3 bar. (e,f) FE of CO of Sn1Cu, In1Cu, and benchmark catalysts Ag, ZnO, and CoPc at 20 °C (e) and 60 °C (f). (g) Outlet gas concentration and FE of CO for Sn1Cu at 300 mA cm–2 under different CO2 flow rates. (h) Stability of Sn1Cu operated at 500 mA cm–2 under 60 °C (a 40 μm AEM was employed for stability testing). Error bars represent the standard deviation from three independent measurements (n = 3).
图3确立了该工作的技术优势。数据表明,随着温度升高至60°C,CO的分电流密度显著增加(In₁Cu从140提升至1052 mA cm⁻²),而C₂⁺产物的选择性则大幅下降。最关键的是,与商业银(Ag)催化剂在高温下表现平平(甚至因析氢增加而下降)形成鲜明对比,In₁Cu和Sn₁Cu展现了独特的温度适应性,证明了其在工业级高温电解槽中的巨大潜力。
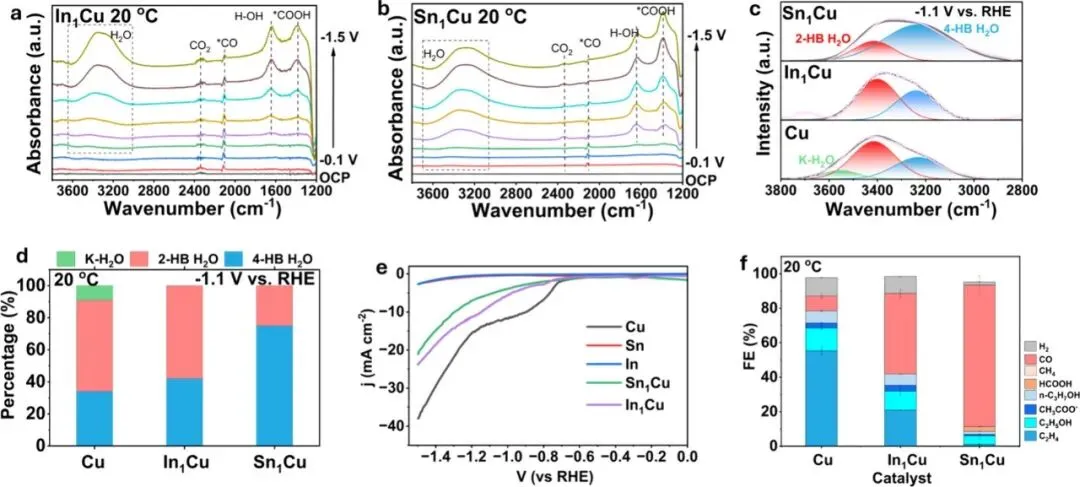
图4:室温(20°C)下的反应机理研究。(a, b) 原位ATR-SEIRAS光谱(COOH与CO吸附峰),(c, d) 界面水的氢键结构分析,(e) 析氢反应(HER)动力学,(f) 300 mA cm⁻²下的产物选择性对比。
Figure 4: Mechanistic study of CO2 reduction on In1Cu and Sn1Cu at 20 °C. (a,b) In situ ATR-SEIRAS spectra of In1Cu (a) and Sn1Cu (b) from −0.1 to −1.5 V vs RHE. (c) Gaussian deconvolution of the O–H stretching band of in situ ATR-SEIRAS spectra of Cu, In1Cu and Sn1Cu at −1.1 V vs RHE. (d) Population of K–H2O, 2-HB H2O, and 4-HB H2O of Cu, In1Cu and Sn1Cu at −1.1 V vs RHE. (e) LSV curve of Cu, In, Sn, In1Cu, and Sn1Cu in Ar purged 0.1 M KHCO3. (f) Product distribution of Cu, In1Cu, and Sn1Cu at 300 mA cm–2.
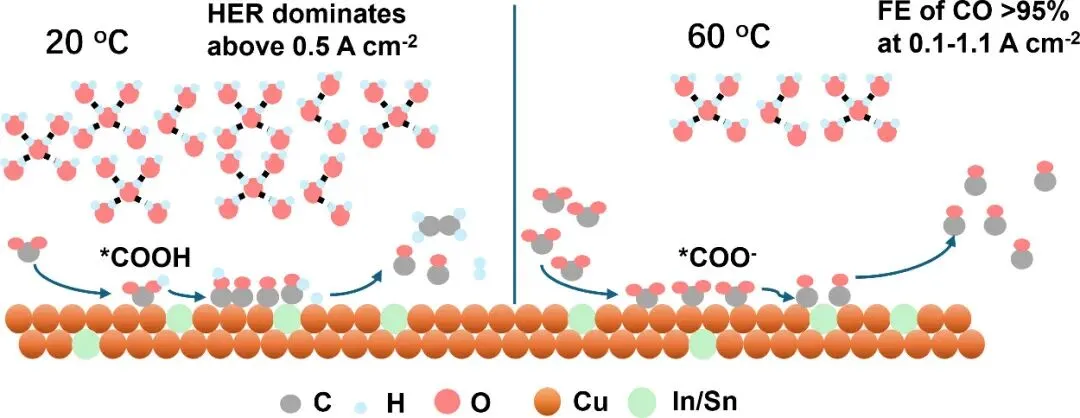
图4解析了室温下的反应环境。通过原位红外光谱,作者发现在室温下,催化剂表面存在明显的*COOH中间体信号,且界面水网络以较强的氢键结合为主。In和Sn的引入虽然惰化了水的解离能力(抑制了H的生成),但在室温下仍不足以完全阻断C-C耦合路径,因此仍能观察到一定量的C₂⁺产物。
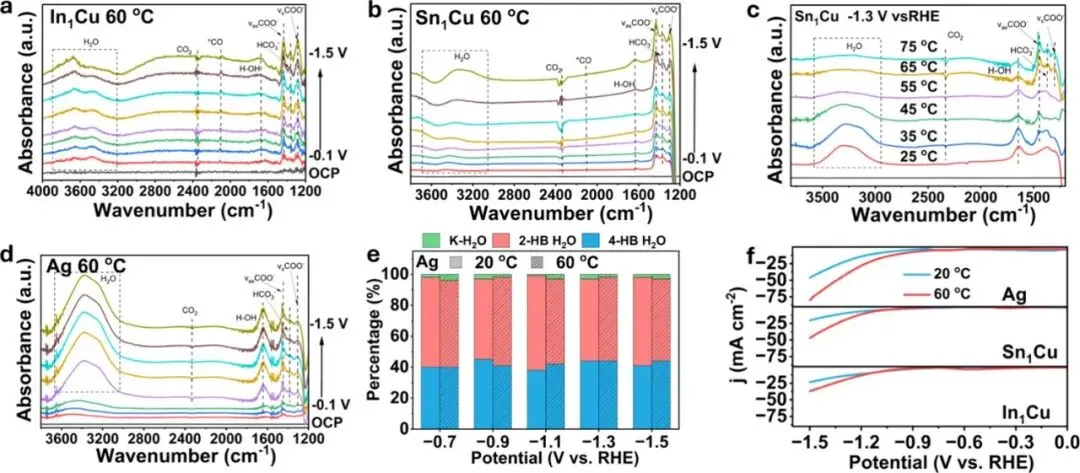
图5:高温(60°C)下的界面结构演变。(a, b) 原位ATR-SEIRAS光谱显示*COO⁻路径的主导地位,(c) 温度对界面水活性、*COO⁻覆盖度及CO₂消耗率的影响,(d, e) 银(Ag)催化剂在不同温度下的对比,(f) 不同材料对温度诱导的析氢抑制响应。
Figure 5: Mechanistic study of CO2 reduction on In1Cu, Sn1Cu, and Ag at 60 °C. (a,b) In situ ATR-SEIRAS spectra of In1Cu (a) and Sn1Cu (b) from −0.1 to −1.5 V vs RHE at 60 °C. (c) In situ ATR-SEIRAS spectra of Sn1Cu at −1.3 V vs RHE from 25 to 75 °C. (d) In situ ATR-SEIRAS spectra of Ag from −0.1 to −1.5 V vs RHE at 60 °C. (e) Comparison of population of K–H2O, 2-HB H2O, and 4-HB H2O for Ag between 20 and 60 °C from −0.7 to −1.1 V vs RHE. (f) LSV curve of In1Cu, Sn1Cu, and Ag in Ar-purged 0.1 M KHCO3 at 20 and 60 °C.
图5是本研究的核心机理发现。在60°C下,原位红外光谱捕捉到了强烈的COO⁻(羧酸根)特征峰,这表明反应路径已从室温的质子耦合电子转移(CPET)转变为高温下的电子驱动路径(SPET)。同时,界面水的信号显著衰减,证明高温“驱逐”了催化剂表面的水分子,从而切断了CO加氢生成烃类或醇类的路径。这种独特的界面水重构是实现高选择性的关键。














 10个月宝宝每天需要喝多少奶粉?

