南京林业大学张金池教授团队最新New Phytologist揭示微生物接种通过根系分泌物介导的微生物关联网络增强土壤团聚体形成与碳稳定化!
欢迎点击上方名片关注!推送等相关事宜直接后台私信即可!关于紫穗槐(Amorpha fruticosa Linn.)根系分泌物如何介导微生物接种(苏云金芽孢杆菌 Bacillus thuringiensis NL-11 和布特勒氏共头霉 Gongronella butleri NL-15)对土壤团聚体形成的促进作用,目前尚不明确。为解决这一科学问题,我们开展了两个温室实验和一个受控室内培养实验。温室实验结果表明,微生物接种提高了根系分泌物释放量,改变了土壤微生物群落结构,并增强了土壤团聚作用及平均重量直径(MWD)。微生物接种增加了不同粒径土壤团聚体中细菌—真菌—根系分泌物关联网络的节点数和连接数。网络特征,包括节点数量、总连接数以及微生物—分泌物(ME)连接数,与土壤 MWD 和矿物结合态有机碳(MAOC)均呈显著正相关。偏最小二乘路径模型(PLS-PM)表明,微生物接种通过提高 MAOC 含量间接促进 MWD 增加,而 MAOC 的增加进一步强化了微生物—分泌物之间的关联。室内培养实验进一步表明,单次添加由接种诱导产生的根系分泌物并未促进大团聚体形成,但相较于对照显著提高了 MAOC 含量。接种诱导的根系分泌物增加了所有团聚体粒径中细菌—真菌关联网络的节点数和连接数,且这些网络特征与 MAOC 呈显著正相关。本研究表明,微生物接种可通过根系分泌物介导的微生物关联网络促进土壤团聚体形成与碳稳定化。
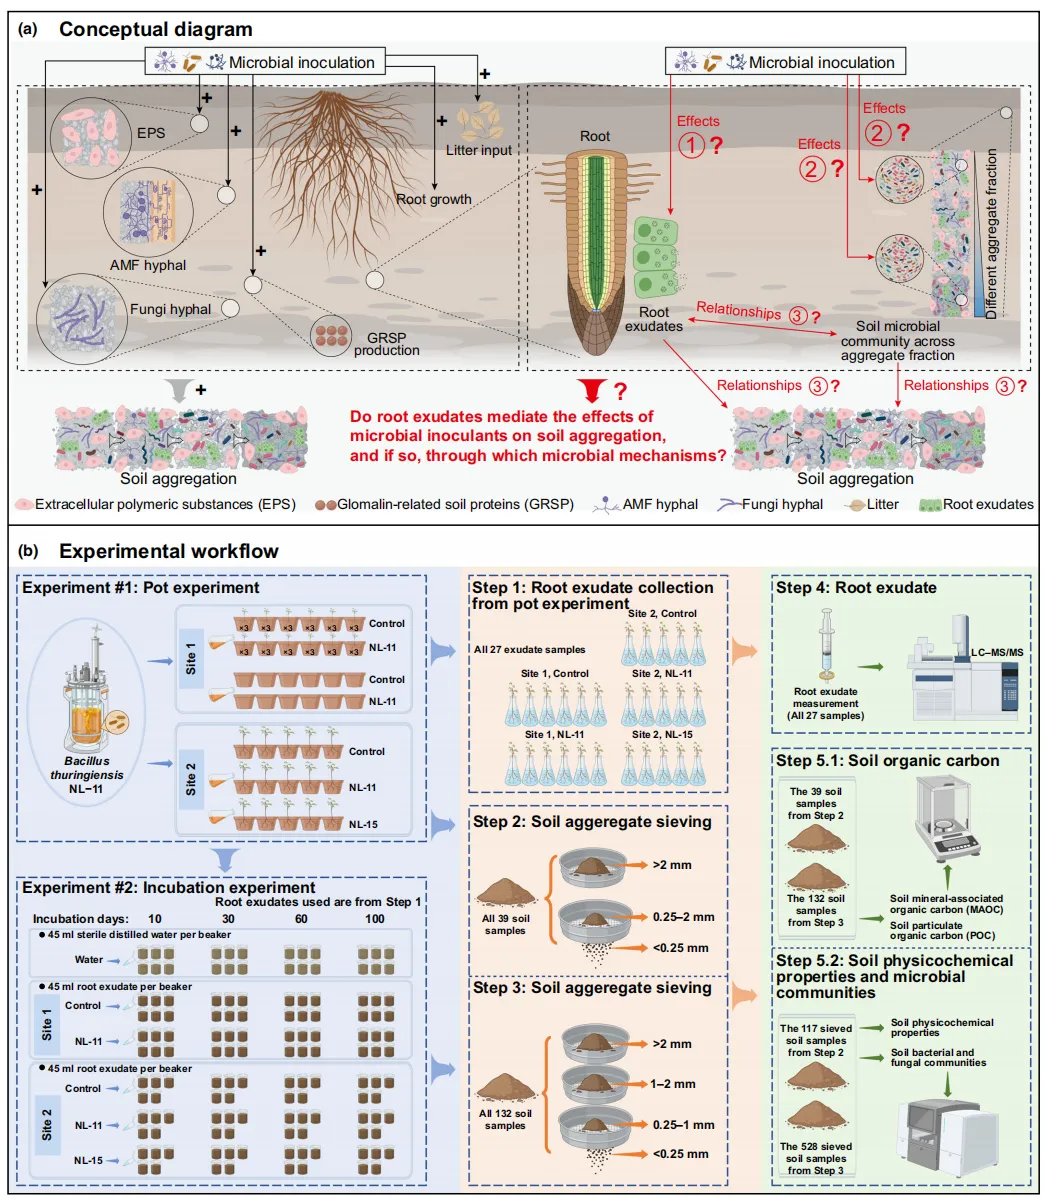
Fig. 1 Conceptual framework (a) and experimental workflow (b) illustrating the study design used to evaluate the effects of microbial inoculation on soil aggregation, root exudates of Amorpha fruticosa Linn., and microbial communities. The symbol‘+’ indicates expected positive effects of microbial inoculation on these indices. Black arrows indicate established or proposed effects of microbial inoculation on soil aggregation processes, whereas red arrows and question marks highlight the key mechanisms and relationships investigated in this study. The icons in the conceptual diagram were created using BioRender icons (created in BioRender. Ma, S. (2026) https://BioRender.com/g91g503). AMF: arbuscular mycorrhizal fungi.
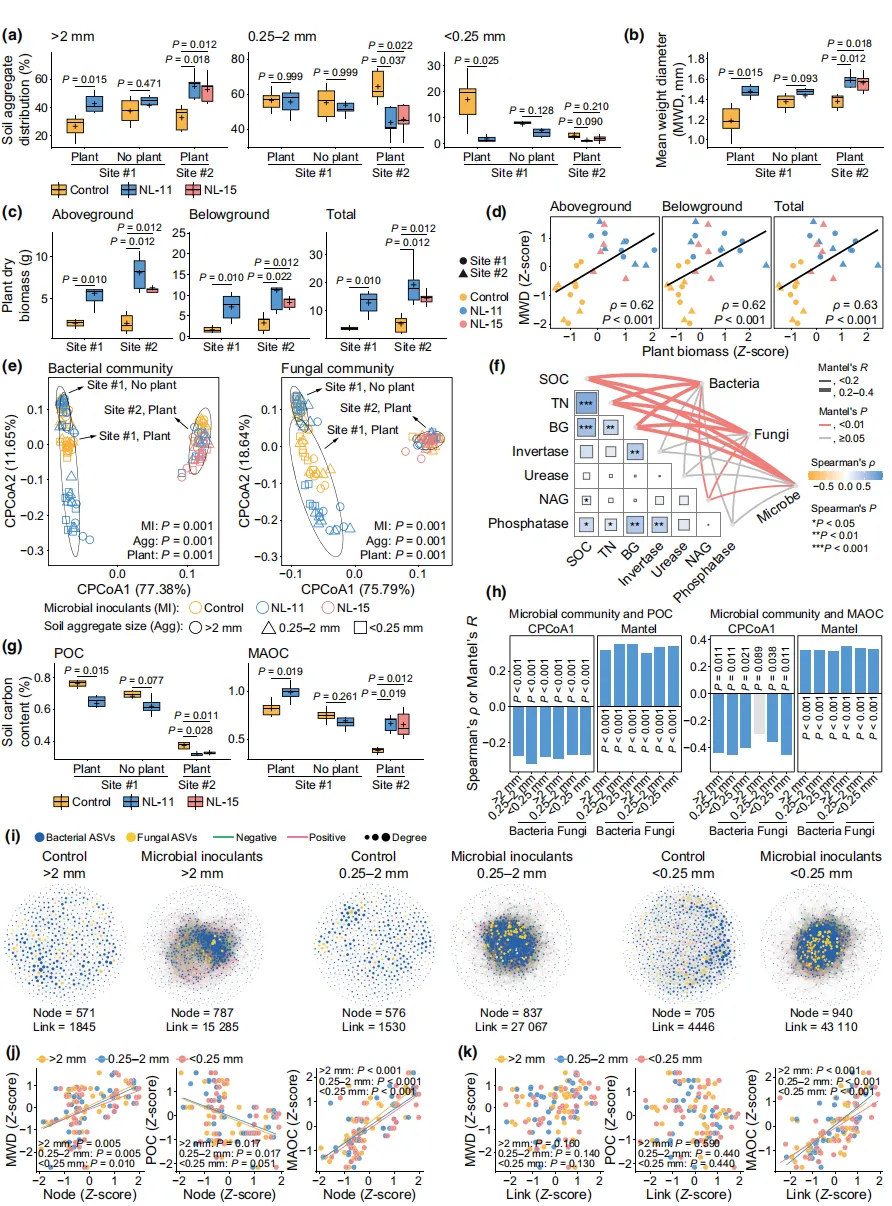
Fig. 2 Effects of microbial inoculation on soil aggregation, organic carbon fractions, and microbial communities in glasshouse experiments. (a) Effects of microbial inoculation on soil aggregate size distribution. (b) Effects of microbial inoculation on soil mean weight diameter (MWD) . (c) Effects of microbial inoculation on the dry biomass of Amorpha fruticosa Linn. Box-Whisker plots show the mean (plus sign), median (center line), interquartile range (box), and 5th–95th percentiles (whiskers) . Statistical comparisons are performed using two-tailed Wilcoxon rank-sum tests, with P values adjusted using the Benjamini–Hochberg false discovery rate (FDR) correction. (d) Spearman correlations between MWD and aboveground and belowground biomass. Black lines represent fitted relationships, with 95% confidence intervals (CIs) shown as grey shading. P values indicate two-sided significance and are adjusted using the Benjamini–Hochberg method with sequentially modified Bonferroni correction. (e) Constrained principal coordinate analysis (CPCoA) of Bray–Curtis dissimilarities showing bacterial and fungal community structures across treatments. Permutational multivariate analysis of variance(PERMANOVA) is used to test the effects of microbial inoculation, aggregate size, and plant presence. P values are adjusted using the Benjamini–Hochberg method with sequentially modified Bonferroni correction. (f) Relationships between soil properties, enzyme activities, and microbial communities (bacteria and fungi) based on Mantel and Spearman correlation analyses. The lower triangular heatmap shows Spearman’s ρ among soil physicochemical properties and enzyme activities, with significance levels indicated as P < 0.05, P < 0.01, and P < 0.001. The upper network depicts Mantel test results, where line thickness represents Mantel’s R and colors indicate significance levels (P < 0.01, 0.01–0.05, or ≥0.05) . BG, β-1,4-glucosidase; NAG, β-1,4-Nacetylglucosaminidase; SOC, soil organic carbon; TN, total nitrogen. (g) Effects of microbial inoculation on soil particulate organic carbon (POC) and mineral-associated organic carbon (MAOC) . (h) Spearman and Mantel correlation analyses showing relationships between POC, MAOC, and microbial communities across aggregate size fractions. Bars represent Spearman’s ρ or Mantel’s R, and numbers indicate corresponding P values. (i) Effects of microbial inoculation on soil microbial association networks across aggregate size fractions. (j) Spearman correlations between microbial association network node number and MWD, POC, and MAOC. (k) Spearman correlations between microbial association network link number and MWD, POC, and MAOC. Different dashed line colors represent different aggregate size fractions.
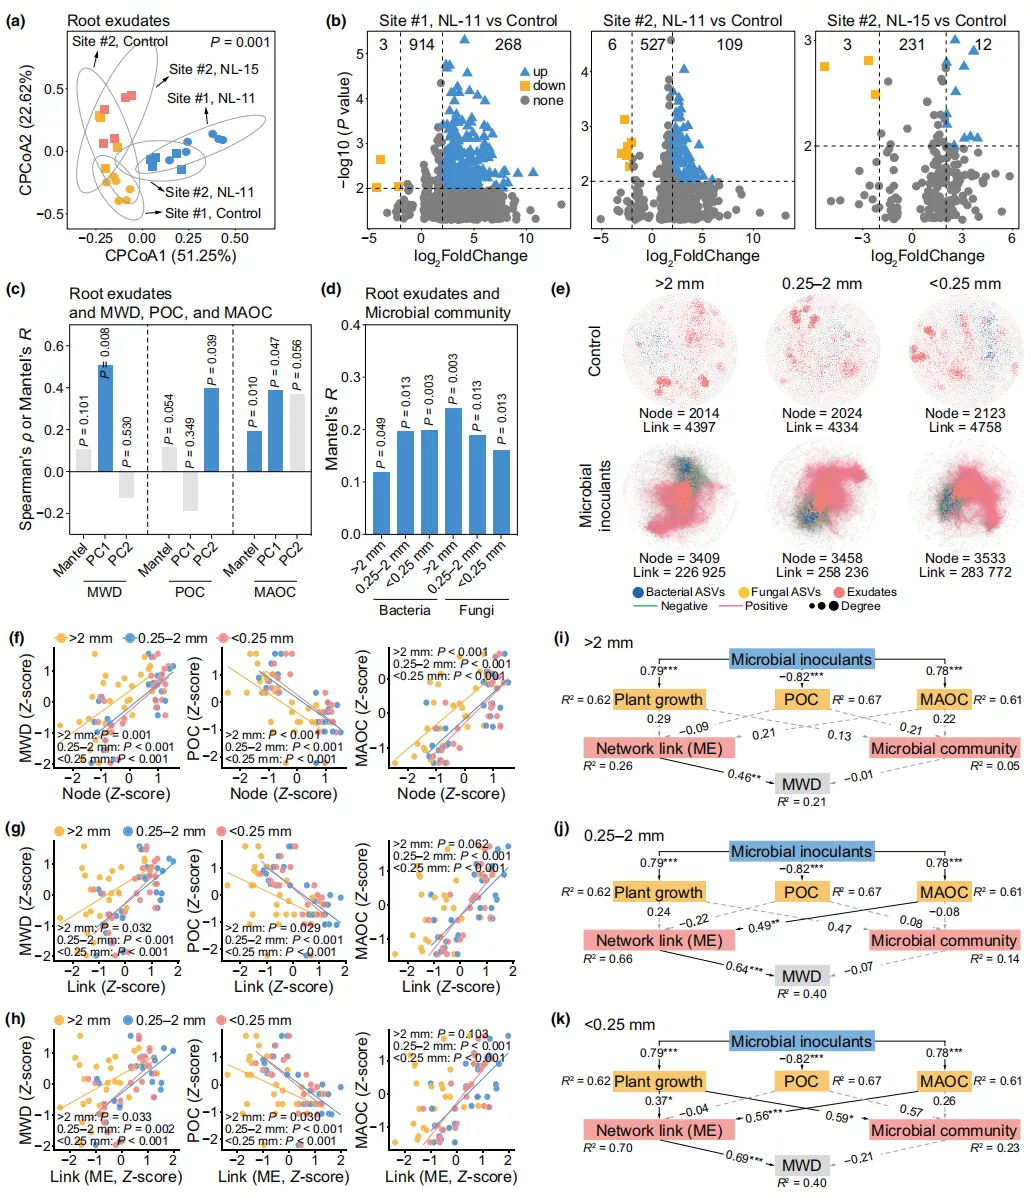
Fig. 3 Effects of microbial inoculation on root exudates of Amorpha fruticosa Linn. in glasshouse experiments. (a) Constrained principal coordinate analysis(CPCoA) of Bray–Curtis dissimilarities showing variation in root exudate composition across treatments. Permutational multivariate analysis of variance(PERMANOVA) is used to assess the effect of microbial inoculation, with P values adjusted using the Benjamini–Hochberg method with sequentially modified Bonferroni correction. (b) Effects of microbial inoculation on root exudate profiles determined by liquid chromatography–tandem mass spectrometry (LC–MS/MS) . Numbers indicate metabolites that are significantly enriched or depleted. (c) Spearman and Mantel correlation analyses showing relationships between particulate organic carbon (POC), mineral-associated organic carbon (MAOC), and root exudates across aggregate size fractions. (d) Mantel test results showing correlations between root exudate composition and bacterial and fungal community structures across aggregate size fractions. Bars represent Spearman’s ρ or Mantel’s R, and numbers indicate P values. (e) Effects of microbial inoculation on microbial–exudate (ME) association networks across aggregate size fractions. (f) Spearman correlations between ME association network node number and mean weight diameter(MWD), POC, and MAOC. (g) Spearman correlations between ME association network link number and MWD, POC, and MAOC. (h) Spearman correlations between ME links (including only microbe–exudate associations) and MWD, POC, and MAOC. Different dashed line colors represent different aggregate size fractions. P values indicate two-sided significance and are adjusted using the Benjamini–Hochberg method with sequentially modified Bonferroni correction. (i–k) Partial least squares path modeling (PLS-PM) illustrating direct and indirect effects of microbial inoculation, plant growth, POC, MAOC, ME network links, and microbial community structure (PC1 axis) on MWD within > 2 mm (i), 0.25–2 mm (j), and < 0.25 mm (k) aggregate size fractions. Black solid arrows indicate significant pathways, and grey dashed arrows indicate nonsignificant pathways. Numbers represent standardized path coefficients. Asterisks indicate significance levels (* , P < 0 .05; ** , P < 0.01; and *** , P < 0 .001) .
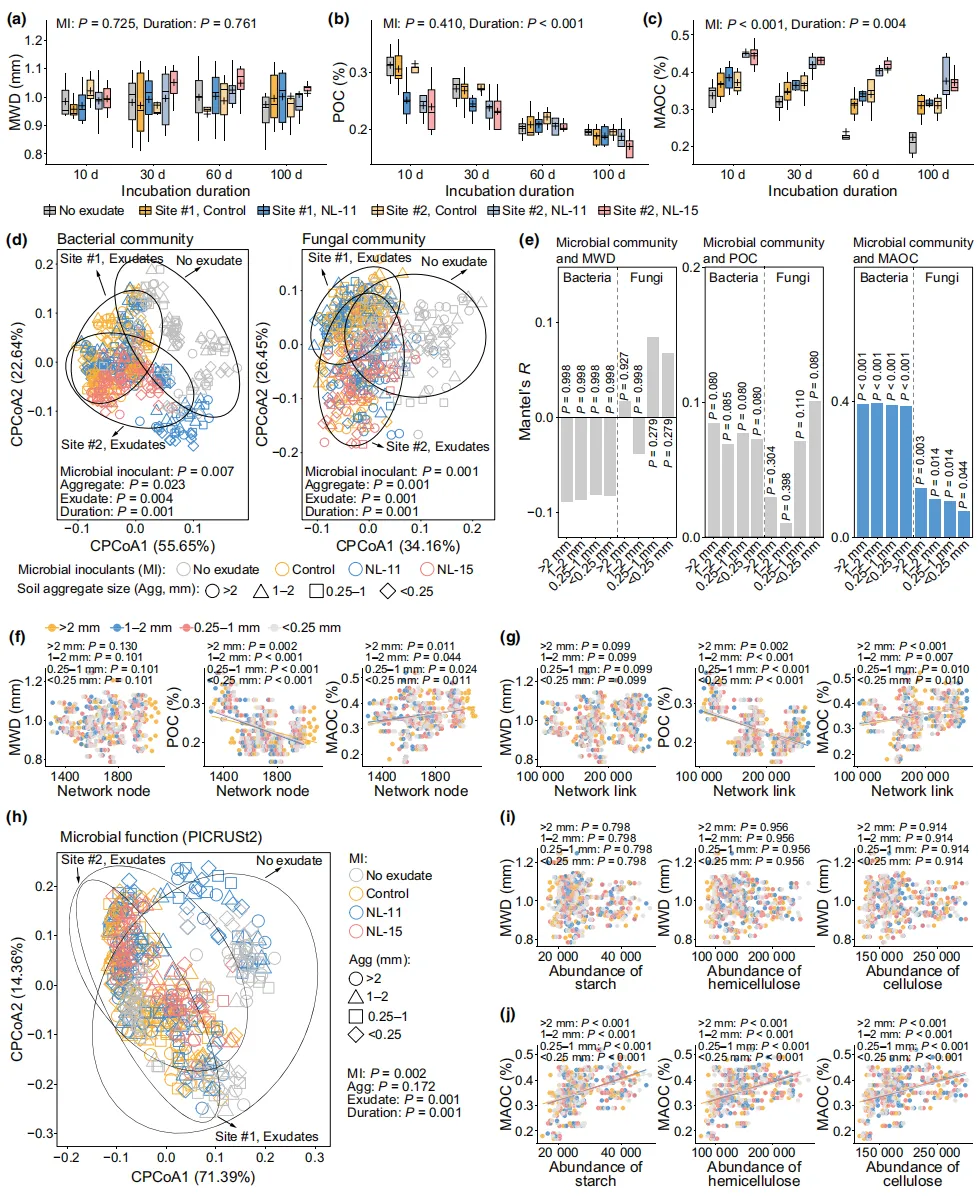
Fig. 4 Effects of microbial inoculation-induced root exudates of Amorpha fruticosa Linn. on soil aggregation, microbial communities, and organic carbon during incubation experiments. (a) Effects of inoculation-induced root exudates on soil mean weight diameter (MWD) . (b, c) Effects of inoculation-induced root exudates on soil particulate organic carbon (POC) and mineral-associated organic carbon (MAOC) . Box-Whisker plots show the mean (plus sign), median (center line), interquartile range (box), and 5th–95th percentiles (whiskers) . Linear mixed effect models (LMMs) are used to assess the effects of microbial inoculation (MI) and incubation duration (D) . (d) Constrained principal coordinate analysis (CPCoA) of Bray–Curtis dissimilarities showing bacterial and fungal community structures across treatments. Permutational multivariate analysis of variance (PERMANOVA) is used to assess the effects of inoculation-induced exudates, aggregate size, and incubation duration, with P values adjusted using the Benjamini–Hochberg method with sequentially modified Bonferroni correction. (e) Mantel test results showing correlations between microbial communities and MWD, POC, and MAOC across aggregate size fractions. Bars represent Mantel’s R, and numbers indicate corresponding P values. Significant correlations (P < 0.05) are shown in blue, and nonsignificant correlations (P ≥0.05) are shown in gray. (f) Spearman correlations between microbial association network node number and MWD, POC, and MAOC. (g) Spearman correlations between microbial association network link number and MWD, POC, and MAOC. Different dashed line colors represent different aggregate size fractions. P values indicate two-sided significance and are adjusted using the Benjamini–Hochberg method with sequentially modified Bonferroni correction. (h) CPCoA of Bray–Curtis dissimilarities showing predicted microbial functional profiles (PICRUSt2) across treatments. (i) Spearman correlations between MWD and predicted abundances of starch-, hemicellulose-, and cellulose-degrading functions. (j) Spearman correlations between MAOC and predicted abundances of starch-, hemicellulose-, and cellulose-degrading functions.
 10个月宝宝每天需要喝多少奶粉?
