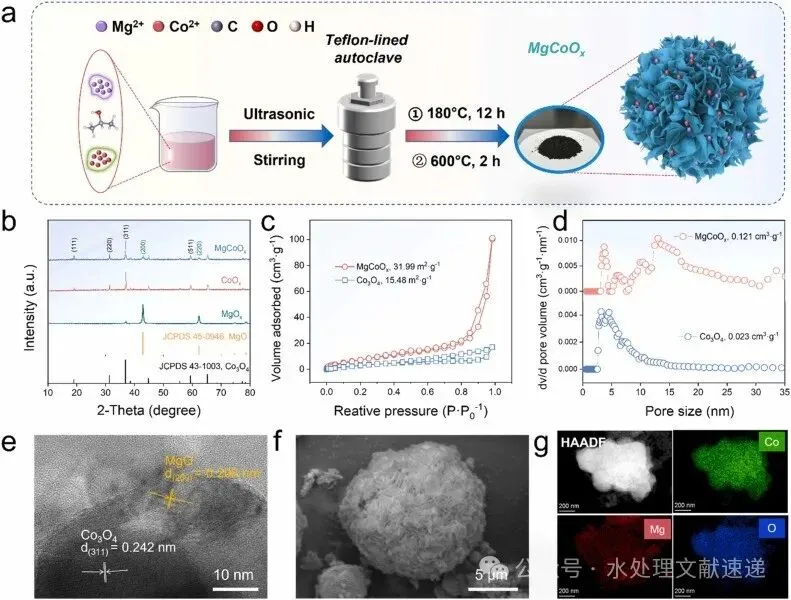
Fig. 1. (a) Illustration of the synthesis process of the MgCoOx sample. (b) XRD patterns, (c) N2 adsorption-desorption isotherms, and (d) pore size distributions of different samples. (e) HRTEM image, (f) SEM image, and (g) EDS elements mapping of the MgCoOx sample.
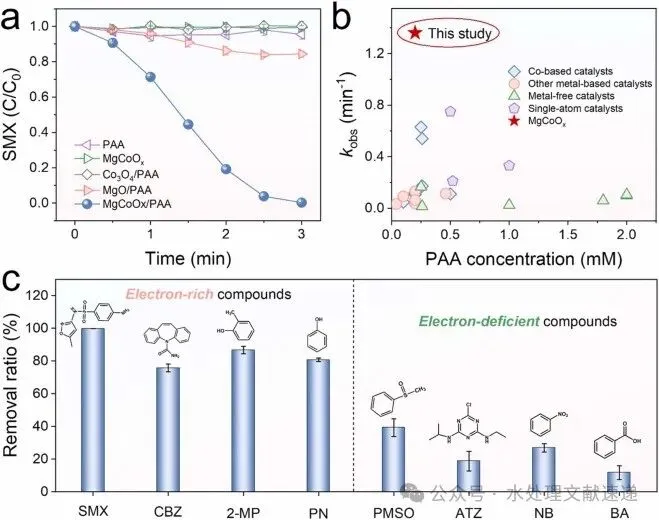
Fig. 2. (a) SMX degradation in various systems. (b) A comparison between MgCoOx and other catalysts for PAA activation. (c) Degradation of different organic contaminants in the MgCoOx/PAA system. (Experiment conditions: [MgCoOx] = 0.2 g/L, [PAA] = 0.2 mM, [contaminants] = 10 μM and [pH]0 = 6.50).
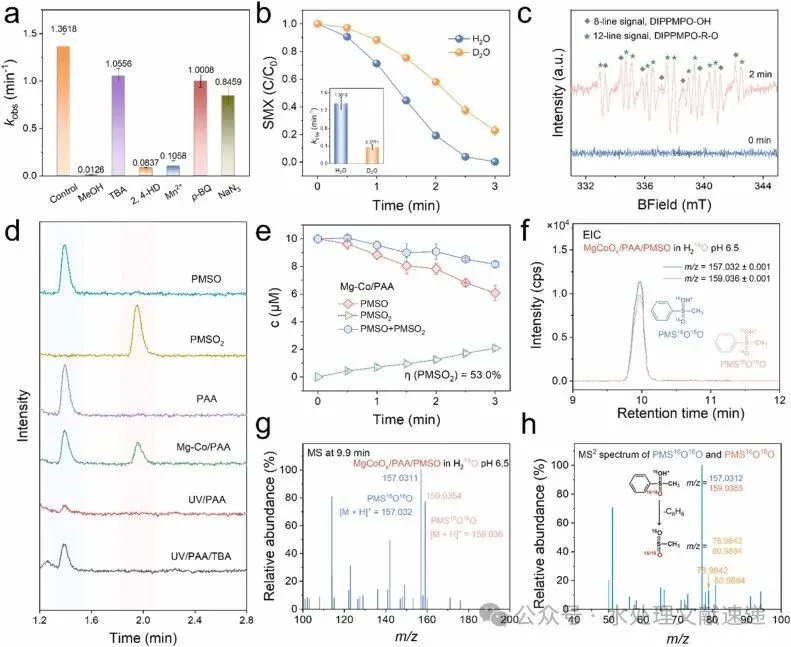 Fig. 3. (a) Rection rate constants of SMX in the presence of different scavengers. (b) Degradation of SMX in H2O or D2O matrix. (c) EPR signals using DIPPMPO as the trapping agent. (d) HPLC signals of PMSO and PMSO2 detected in different systems after 3.0 min of reaction. (e) PMSO degradation and PMSO2 production in the MgCoOx/PAA system. (f) Extracted ion chromatogram (EIC) signals of PMS16O16O and PMS16O18O, (g, h) and the corresponding MS and MS2 spectra in the MgCoOx/PAA system. (Experiment conditions: [MgCoOx] = 0.2 g/L, [PAA] = 0.2 mM, [contaminants] = 10 μM, if applied [MeOH] = [TBA] = 100 mM, [2, 4-HD] = 10 mM, [Mn2+] = [p-BQ] = 1.0 mM, [NaN3] = 50 mM and [pH]0 = 6.50).
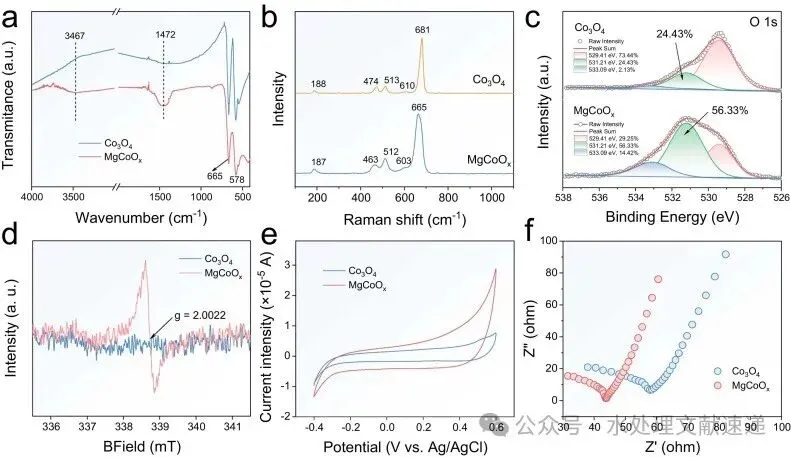
Fig. 4. (a) FT-IR, (b) Raman, (c), high-resolution XPS O 1 s spectra, (d) solid EPR spectra, (e) CV curves, and (f) EIS curves of Co3O4 and MgCoOx.
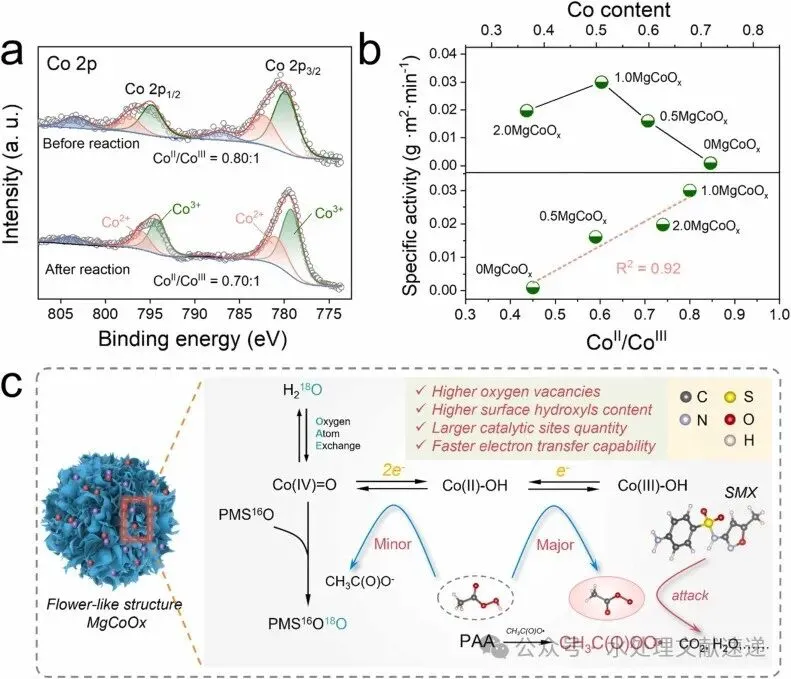
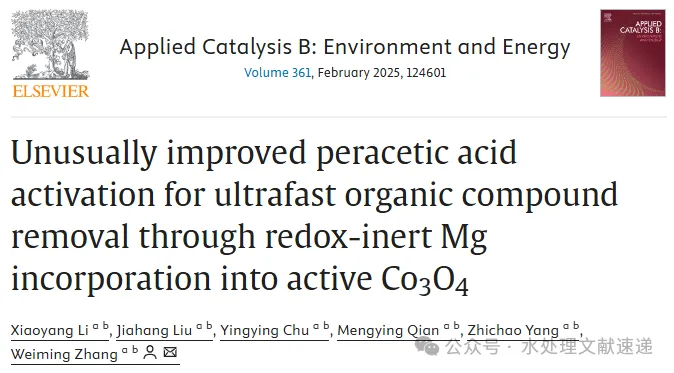
Fig. 5. (a) High-resolution XPS spectra of Co 2p before and after the reaction. (b) Correlations between the specific activity of MgCoOx and Co content or Co2+/Co3+ ratio. (c) Schematic illustration of SMX degradation in the MgCoOx/PAA system.
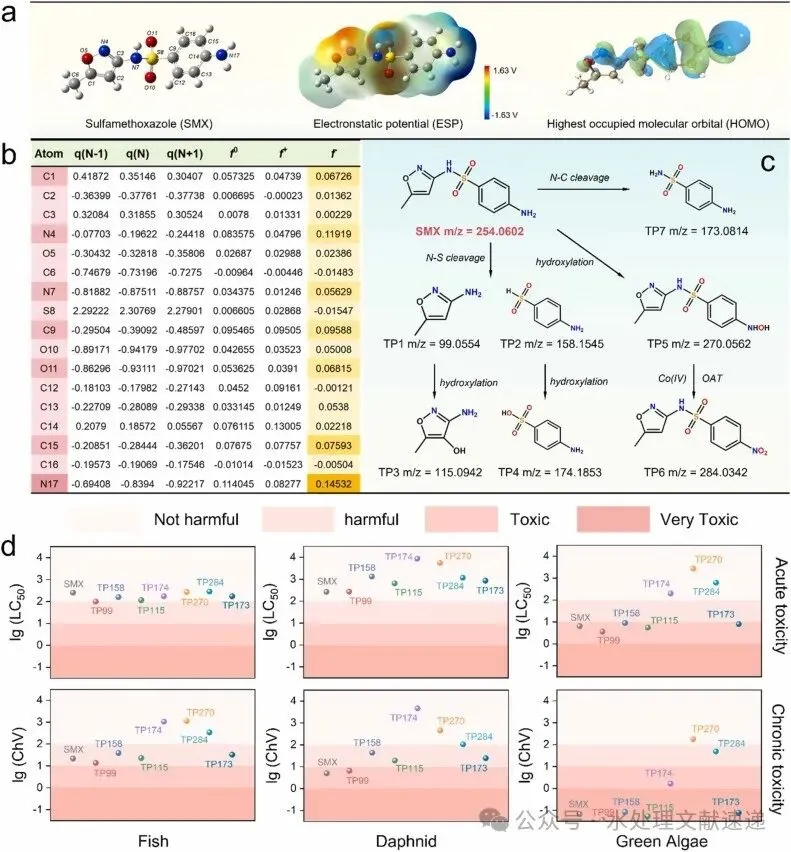
Fig. 6. (a) The chemical structure, HOMO orbital, and ESP distribution of SMX molecular. (b) The NPA charge distribution and Fukui index of SMX. (c) Proposed degradation pathways of SMX. (d) Acute and chronic toxicity of TPs in the MgCoOx/PAA system.


 10个月宝宝每天需要喝多少奶粉?
