南京农业大学叶可萍教授课题组Chemical Engineering Journal发表最新研究成果
- 2026-06-21 13:53:07
(请点击图片查看)
南京农业大学叶可萍教授课题组:胃肠道环境中单增李斯特菌通过形成细菌微室增强其对屎肠球菌B1肠溶素A的抗性
屎肠球菌B1可减轻小鼠单增李斯特菌感染引起的体重下降、降低肝脏、脾脏及肠道组织中的菌载量,并缓解空肠炎症反应。进一步的,在体外模拟胃肠道消化条件下,屎肠球菌B1可显著抑制单增李斯特菌存活,降低其sigB相关应激响应及多种毒力基因表达。值得注意的是,单增李斯特菌在屎肠球菌B1拮抗压力下会形成细菌微室,以增强其在胃肠道环境中的适应能力。同时,屎肠球菌B1中的enlA基因在抑制单增李斯特菌及诱导其细菌微室形成过程中发挥关键作用。该研究揭示了乳酸菌与食源性病原菌在胃肠环境中的互作新机制,为发酵食品安全控制及功能菌株开发提供了新的理论依据。
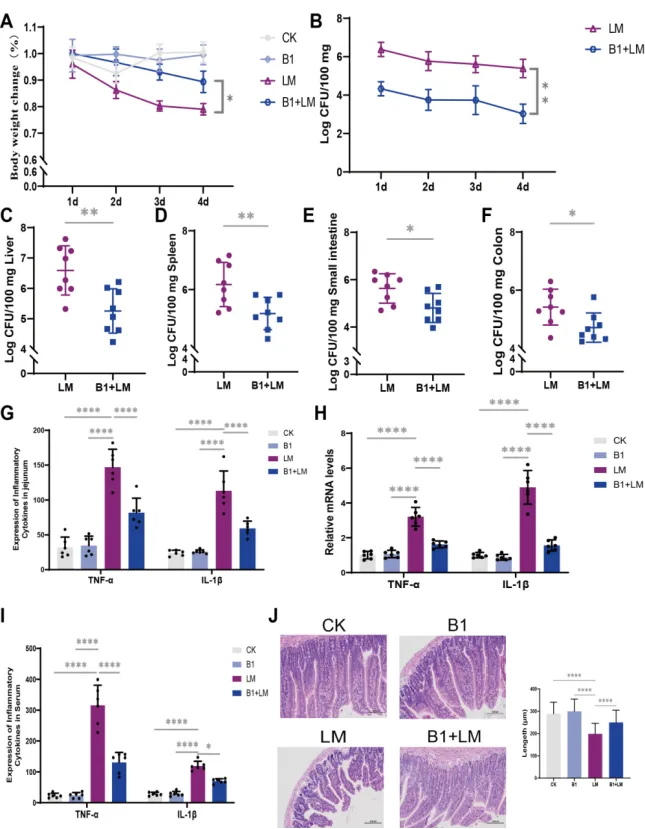
Figure 1 E. faecium B1 alleviatedL. monocytogenesinfectionin mice. (A) The body weight change of mice after L. monocytogenesinfection, n=8; (B-F)The L. monocytogenes loads in feces, liver, spleen, small intestine,and colon, respectively;(G)The concentrations of the pro-inflammatory cytokines TNF-α and IL-1β in jejunum of mice;(H) Relative mRNA levels of inflammatory response-related genes TNF-α and IL-1β in jejunum of mice; (I) The concentrations of the pro-inflammatory cytokines TNF-α and IL-1β in serum of mice;(J) HE staine of jejunum in mice. Significance levels are shown as follows: *P < 0.05, **P < 0.01, ***P < 0.001, and ****P < 0.0001.
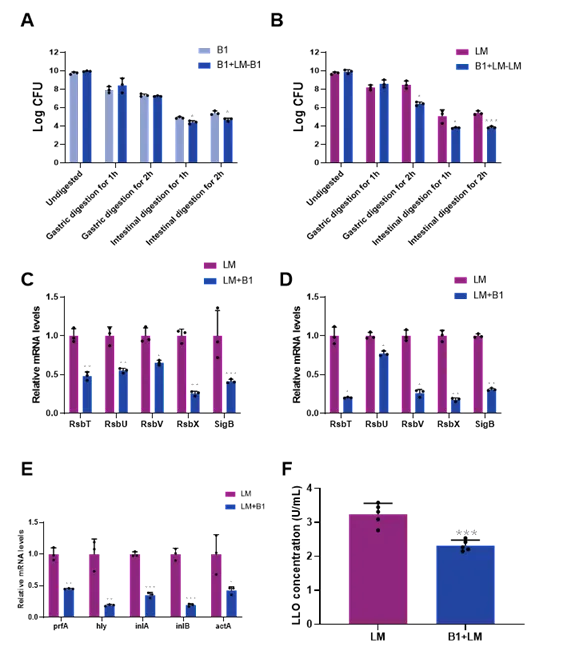
Figure 2 The effects of E. faeciumB1 on the states of L. monocytogenesduring in vitrogastrointestinal digestion. (A) Survival counts of E. faecium B1 in the B1+LM and B1 group; (B) Survival counts of L. monocytogenes in the B1+LM and LM group; (C-D) The expression of sigB-related genes in L. monocytogenesafter gastric and intestinal digestion, respectively; (E-F) The expression of virulence genes and LLO protein in L. monocytogenes after gastrointestinal digestion; Significance levels are shown as follows: *P < 0.05, **P < 0.01, ***P < 0.001, and ****P < 0.0001.
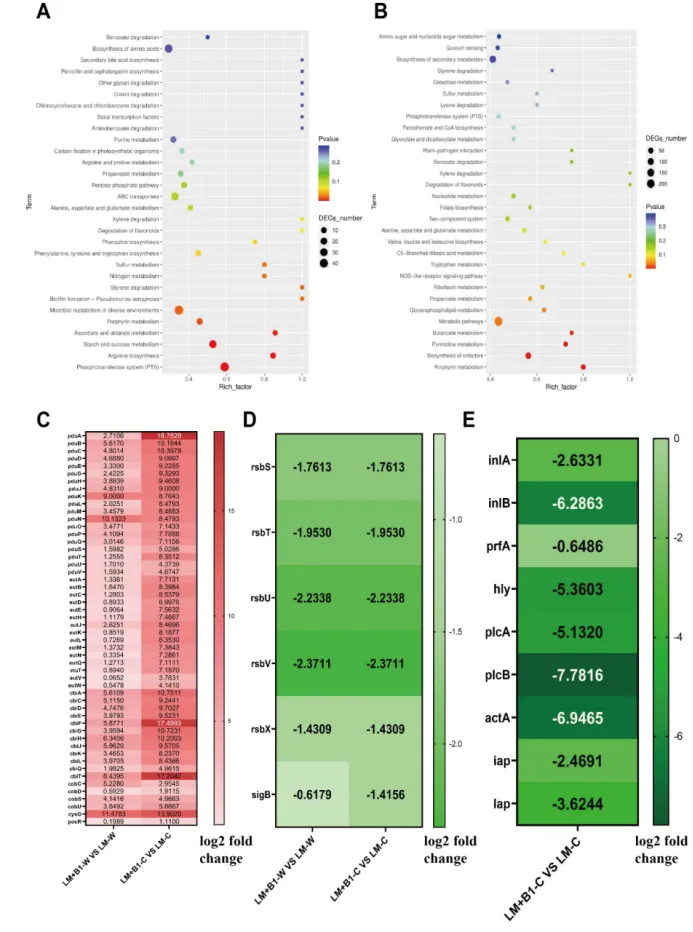
Figure 3 The transcriptomic investigation of L. monocytogenesduring in vitrogastrointestinal digestion.(A-B) KEGG pathway analysis in L. monocytogenes after gastric and intestinal digestion, respectively (comparison of B1+LM vs LM);(C-D) The expression of genes related to bacterial microcompartment and sigB signaling pathway in L. monocytogenesafter gastric digestion and intestinal digestion, respectively (comparison of B1+LM vs LM); (E)The expression of genes related to virulencein L. monocytogenes after intestinal digestion (comparison of B1+LM vs LM).LM-W and LM-C indicate the transcriptomic analysis of L. monocytogenesafter gastric digestion and intestinal digestion, respectively; LM+B1-W and LM+B1-C indicate the transcriptomic analysis of L. monocytogenes in the LM+B1 group after gastric digestion and intestinal digestion, respectively. Genes shown in the heatmaps met the significance threshold of P < 0.05 in transcriptomic analysis.
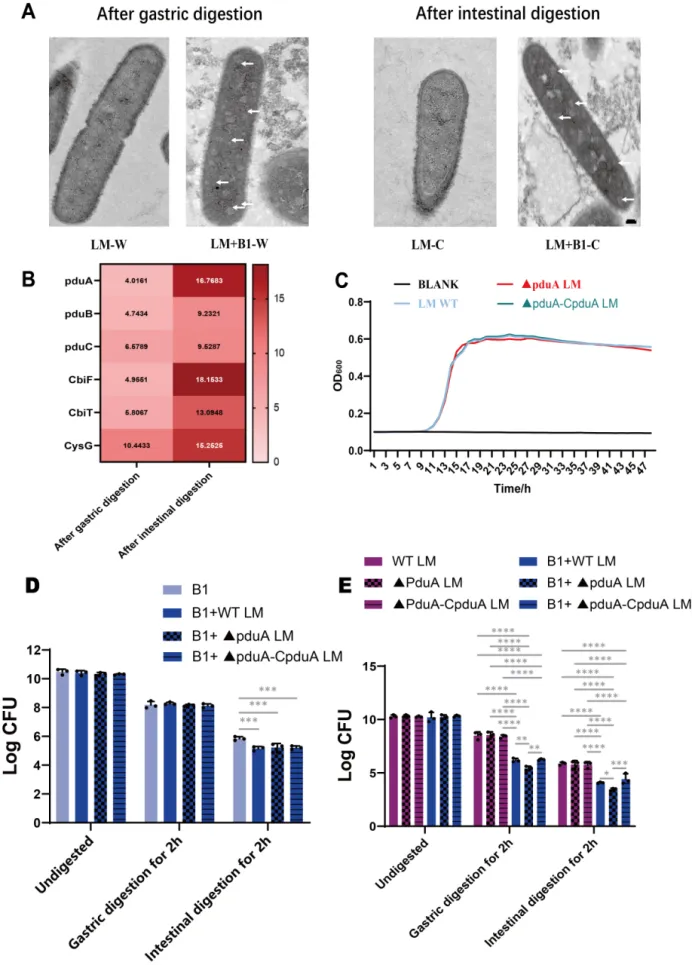
Figure 4 Role of the pduA gene in modulating L. monocytogenes resistance to E. faecium B1 during in vitro gastrointestinal digestion. (A) Transmission electron microscopy observation of L. monocytogenes, the scale bar was 100 nm;(B) The expression of bacterial microcompartment-related genes (comparison of B1+LM vs LM),genes shown in the heatmaps met the significance threshold of P < 0.05; (C) Growth curve of L. monocytogenes;(D) Survival counts of E. faecium B1 in the B1+LM and B1 group; (E) Survival counts of L. monocytogenes in the B1+LM and LM group. Significance levels are shown as follows: *P < 0.05, **P < 0.01, ***P < 0.001, and ****P < 0.0001.
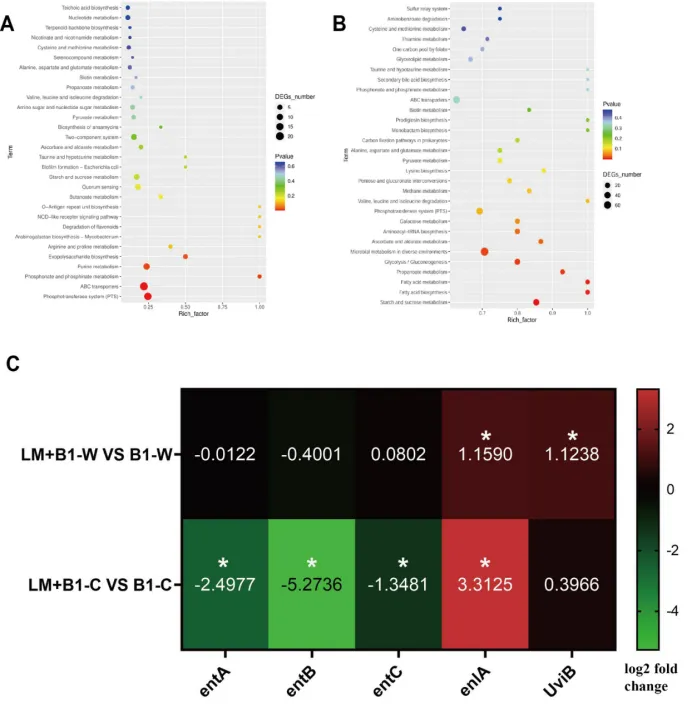
Figure 5 The transcriptomic investigation of E. faecium B1during in vitrogastrointestinal digestion. (A-B) KEGG pathway analysis in E. faecium after gastric and intestinal digestion, respectively (comparison of B1+LM vs B1);(C)The expression of genes related to bacteriocinin E. faecium after gastric and intestinal digestion, respectively (comparison of B1+LM vs B1).B1-W and B1-C indicate the transcriptomic analysis of E. faecium B1 after gastric digestion and intestinal digestion, respectively; LM+B1-W and LM+B1-C indicate the transcriptomic analysis of E. faeciumB1 in the LM+B1 group after gastric digestion and intestinal digestion, respectively.
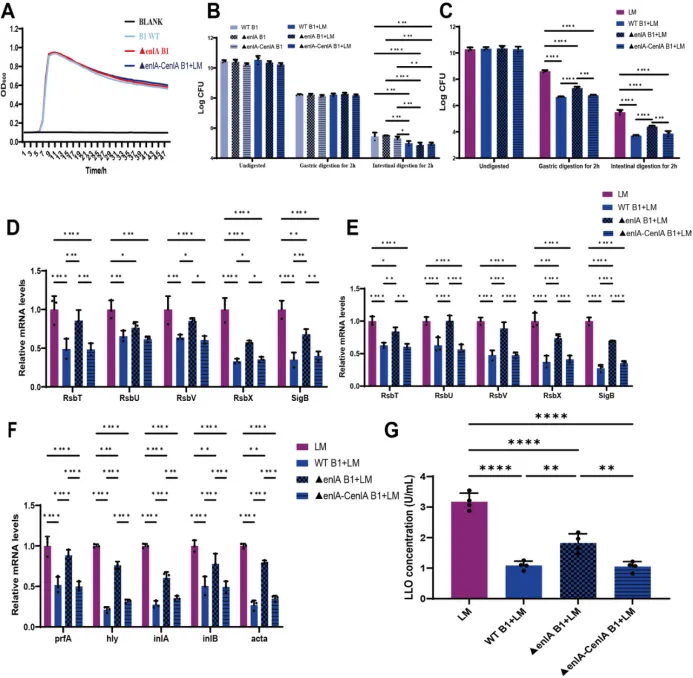
Figure 6 Modulation of L. monocytogenes survival by the enlA gene of E. faecium B1 during in vitro gastrointestinal digestion.(A) Growth curve of E. faecium;(B)Survival counts of E. faecium; (C) Survival counts of L. monocytogenes;(D-E) The expression of sigB-related genes in L. monocytogenesafter gastric and intestinal digestion, respectively.(F-G) The expression of virulence genes and LLO protein in L. monocytogenes after gastrointestinal digestion. Significance levels are shown as follows: *P < 0.05, **P < 0.01, ***P < 0.001, and ****P < 0.0001.
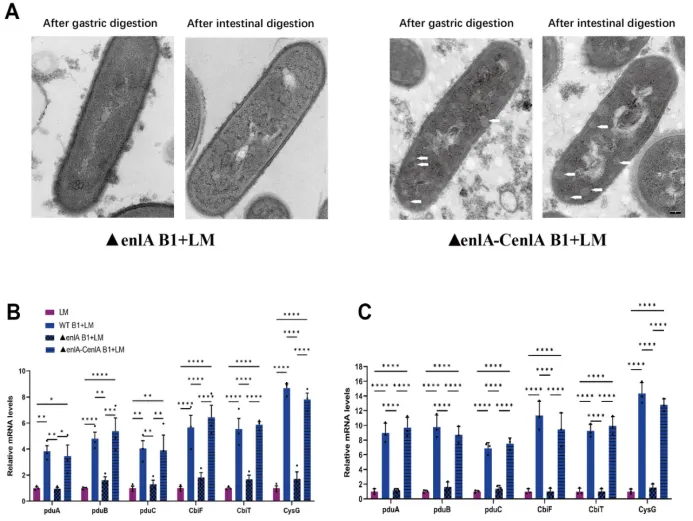
Figure 7 The effect ofE. faecium enlAgene expression on L. monocytogenes bacterial microcompartment formation. (A) Transmission electron microscopy observation of L. monocytogenes, the scale bar was 100 nm;(B-C)The expression of bacterial microcompartment-related genesin L. monocytogenesafter gastric and intestinal digestion, respectively. Significance levels are shown as follows: *P < 0.05, **P < 0.01, ***P < 0.001, and ****P < 0.0001.
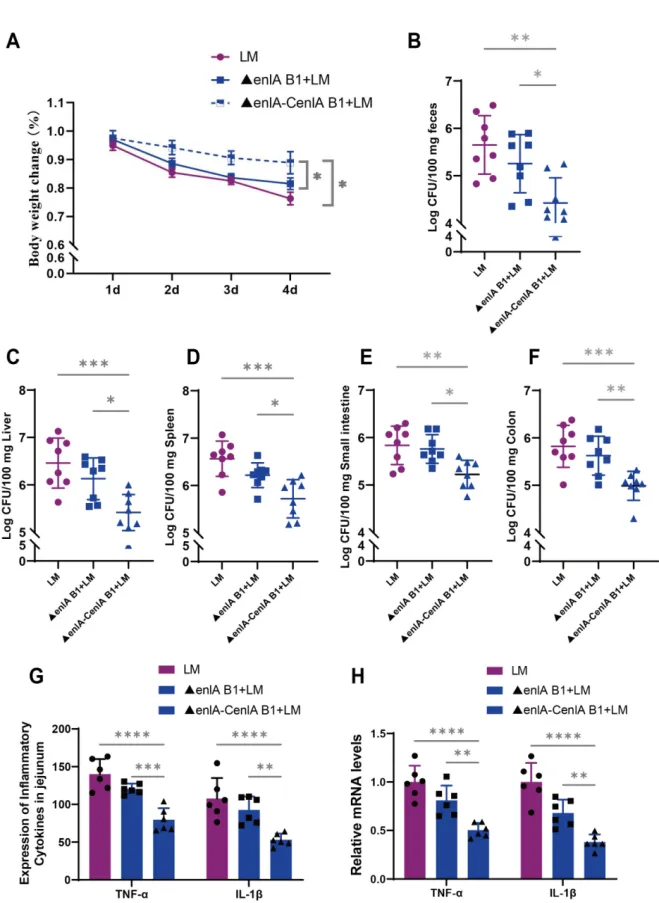
Figure 8 E. faecium B1 enlA gene-mediated inhibition of L. monocytogenes infection in mice. (A) The body weight change of mice after L. monocytogenesinfection, n=8; (B-F)The L. monocytogenes loads in feces, liver, spleen, small intestine,and colon, respectively; (G)The concentrations of the pro-inflammatory cytokines TNF-α and IL-1β in the jejunum of mice; (H) Relative mRNA levels of inflammatory response-related genesTNF-α and IL-1β in the jejunum of mice. Significance levels are shown as follows: *P < 0.05, **P < 0.01, ***P < 0.001, and ****P < 0.0001.
原文链接
https://doi.org/10.1016/j.cej.2026.175904
通讯作者简介

(请点击标题查看)
分子对接与分子动力学黄酮类化合物
食品感官科学与分析农产品贮藏与加工
肉与肉制品蛋与蛋制品水产品
奶及奶制品豆及豆制品果蔬及果蔬制品
大米及米制品
炎症性肠病糖尿病肝病神经疾病
(请点击标题查看)
(请点击学者姓名查看)

在线投稿平台链接:https://www.wjx.top/jq/85151447.aspx
标注‘原创’仅代表原创编译,本平台不主张对原文的版权。本平台转载仅仅是出于学术交流和传播信息的需要,并不意味着代表本平台观点或证实其内容的真实性;转载文章版权归原作者所有,作者如果不希望被转载或有侵权行为,请联系本平台删除。由于编译水平有限,推文或简历有不妥之处,深感抱歉,请联系本平台修改或者删除。
随机文章
-
 10个月宝宝每天需要喝多少奶粉?
- 南京【距您500米】同城附近疏通下水道师傅,通下水道30元起附近上门
- 南京多地警方发布资金返还公告
- 大家快来南京浦口龙王山赏二月兰 : 山野寂静处,人间四月天
- 南京首个全悬浮四代宅!江北又一次走在南京楼市前列(独家首发)
- 南京高等职业技术学校
- 江苏事业单位,南京中医药大学2026年招聘公告
- 南京大学董林/万海勤/邹伟欣&广州大学刘兆清,最新Nature子刊!不对称电荷极化调控活性氢转移助力选择性光还原CO₂制甲烷!尹晨旭一作
- 南京4人接受纪律审查和监察调查
- 南京体育学院考点 | 2026年体育单招及高水平运动队招生体育专项考试考生须知(蹦床、体操、艺术体操、技巧、击剑、现代五项、铁人三项)
- 南京铁道车辆技师学院:高铁名校匠心筑梦
