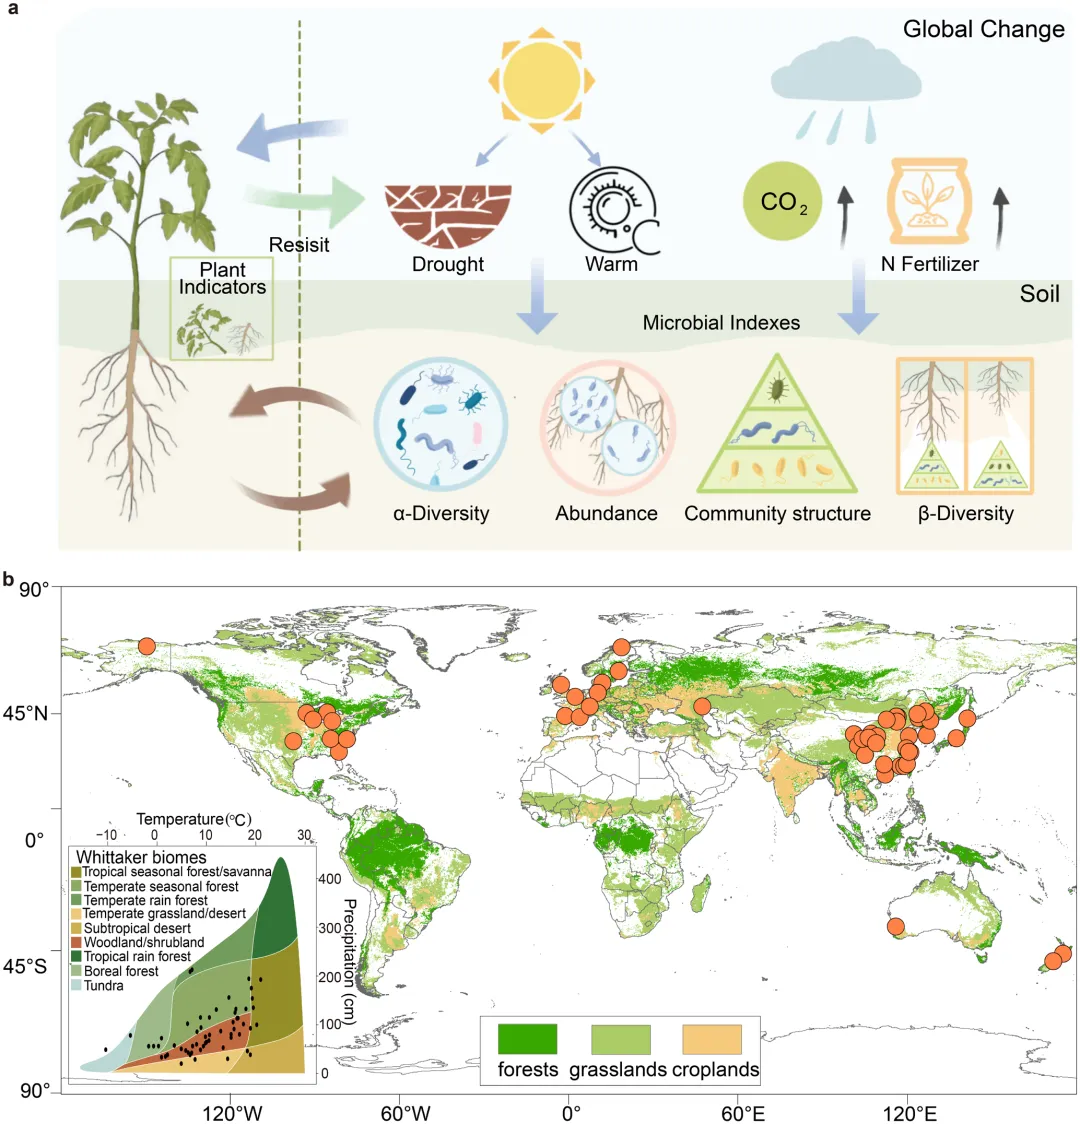
欢迎点击上方名片关注!推送等相关事宜直接后台私信即可!文章来源:Global Change Biology官网在全球变化背景下,陆地植物不仅通过调节自身生理代谢响应环境变化,还伴随着根际微生物群落的适应性重组。然而,植物表型可塑性与微生物群落协同适应之间的机制联系仍不清楚。本研究基于272组全球变化控制实验开展荟萃分析,结果表明,在所有全球变化因子中,氮添加对植物产量和微生物群落组装的影响最为显著。 植物的适应性响应与微生物群落结构的重组关系更为密切,而与α多样性的变化关联较弱。进一步分析发现,微生物群落结构的重组与土壤碳有效性的提高密切相关,而较高的局部微生物β多样性则限制了群落结构重组的幅度。 通过重新分析已发表的扩增子测序数据,我们发现,更加稳定且复杂的微生物共现网络,以及富集变形菌门(Proteobacteria)和放线菌门(Actinobacteria)的微生物群落,与更高的植物产量密切相关。这些研究结果揭示了全球变化背景下植物与微生物之间的协同适应机制,强调微生物群落结构是连接土壤环境变化与植物适应性表现的关键中介。 换言之,相较于微生物多样性本身,微生物群落结构及其相互作用模式更能决定植物对全球变化的适应能力和生产力表现。FIGURE 1 | The global distribution of collected data. (a) Conceptual schematic diagram summarizing the hypotheses of this study. The light blue sections represent various global change factors, and arrows indicate the direction of their effects. (b) The yellow dots represent the geographic locations of the sampled studies. The base map was generated using global land-use classification data, with different colors representing major ecosystem types, including forests, grasslands, and croplands.
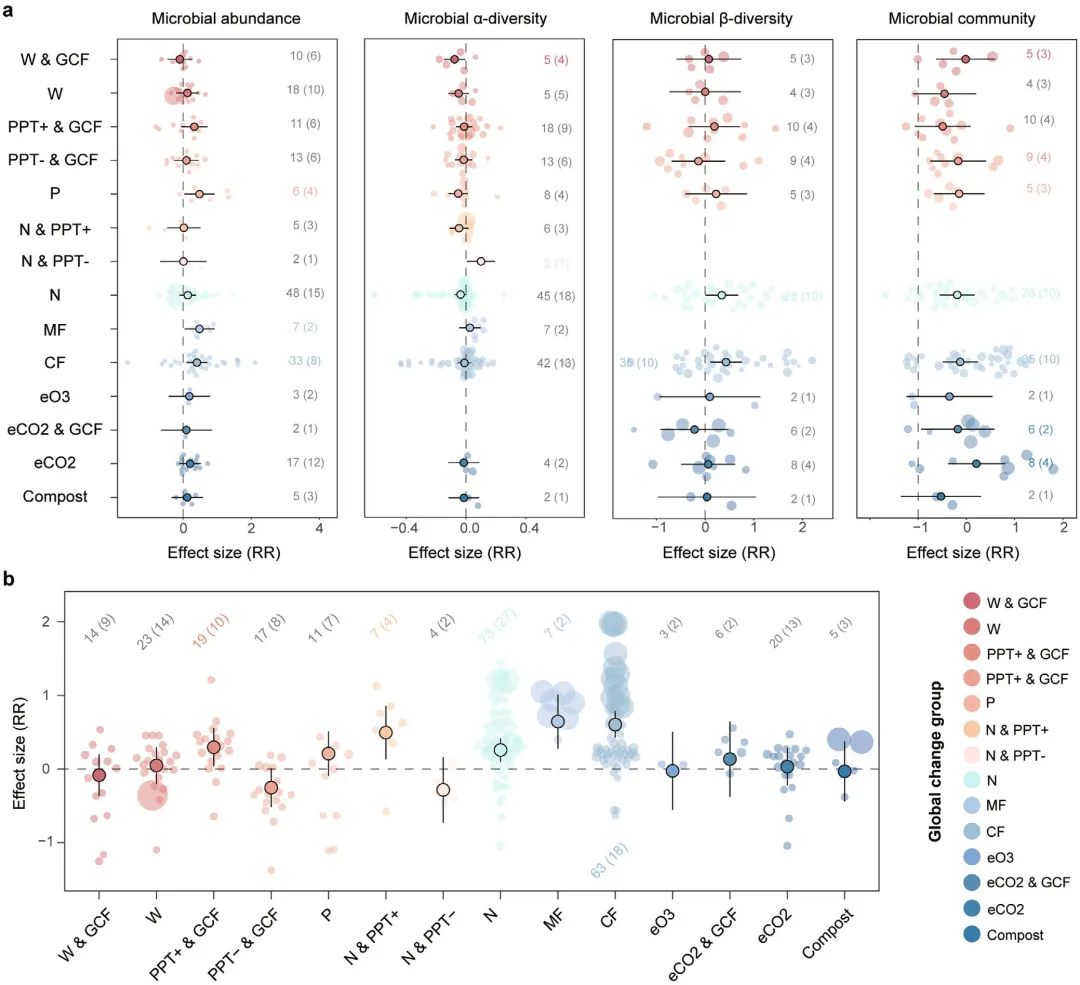
FIGURE 2 | Effects of global change factors on plant yield and soil microbial community traits. (a) Response ratios (RR) of microbial abundance, α-diversity, β-diversity, and microbial community structure under global change. (b) RR of plant yield under global change. Error bars indicate 95% confidence intervals. Numbers outside parentheses denote the number of effect sizes, and numbers inside parentheses denote the number of independent studies; colors represent different global change treatment groups.
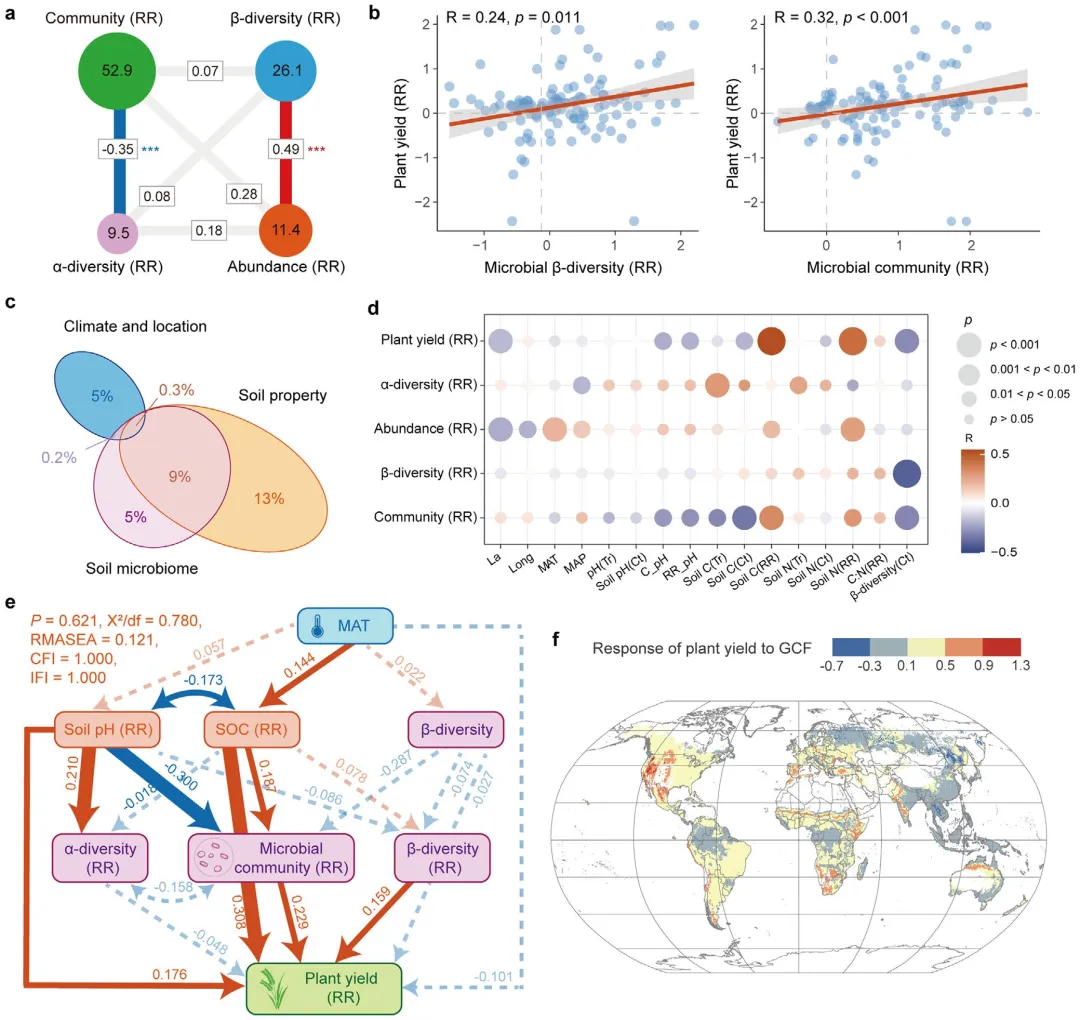
FIGURE 3 | Correlations between plants, soil microorganisms, soil property, and global climate, and visualization of ecological variable relationship based on structural equation model: Effect matrix and path analysis diagram. (a) Multiple linear regression was used to show the contribution of each microbial index to the plant. The size of circle and the number in it represent the degree of contribution of each microbial index to plants. The blue line indicates the negative correlation, and red line indicates the positive correlation. The gray line shows no significant relationship. The line correlations in the figure are determined using the Spearman correlation coefficient. (b) The correlations between plants and microbes in β-diversity and community structure. (c) Microbial-soil-climate variance partition analysis model. The number in the oval shows the contribution degree of environmental factors to plants. (d) Correlations between plants, soil microorganisms, soil property, climate and location. Heatmap showing R2 values for Spearman correlations between plants, soil microorganisms, soil property, climate, and location. Orange and blue indicate the positive and negative correlations, respectively. The darker the color, the stronger the correlation, and the bigger the circle, the more significant the correlation. (e) Structural equation model of climate environment-soil physicochemical-microbial community traits-plant growth under global change. Red solid-line arrows indicate significant positive-effect correlations. Blue solid-line arrows indicate significant negative effect relationships. Blue dashed arrows indicate negative effects, but with no significant correlation. P represents the significance test probability value of the model. χ2/ Df shows the chi-square degrees of freedom ratio. RMSEA indicates approximate error root mean square. CFI and IFI are the comparative and incremental fit index, respectively. (f) Global prediction model of plant yield response ratio under global change. Response of plant yield to GCF indicates the value of the response ratio of plants throughout the world. The ground indicators on the horizontal axis include latitude (La), longitude (Long), mean annual temperature (MAT), mean annual precipitation (MAP), treatment groups of soil pH (pH_Tr), control groups of soil pH (Soil pH_Ct), change values for the treatment groups minus the experimental groups of soil pH (C_pH), the response ratio of pH (RR_pH), treatment groups of soil carbon (soil C (Tr)), control groups of soil carbon (soil C (Ct)), response ratio of soil carbon (soil C (RR)), treatment groups of soil nitrogen (soil N(Tr)), control groups of soil nitrogen (soil C (Ct)), response ratio of soil nitrogen (soil N (RR)), response ratio of carbon-nitrogen ratio (C:N(RR)), response ratio of β-diversity (β-diversity (RR)), and control groups of microbial community structure (MC_Ct).
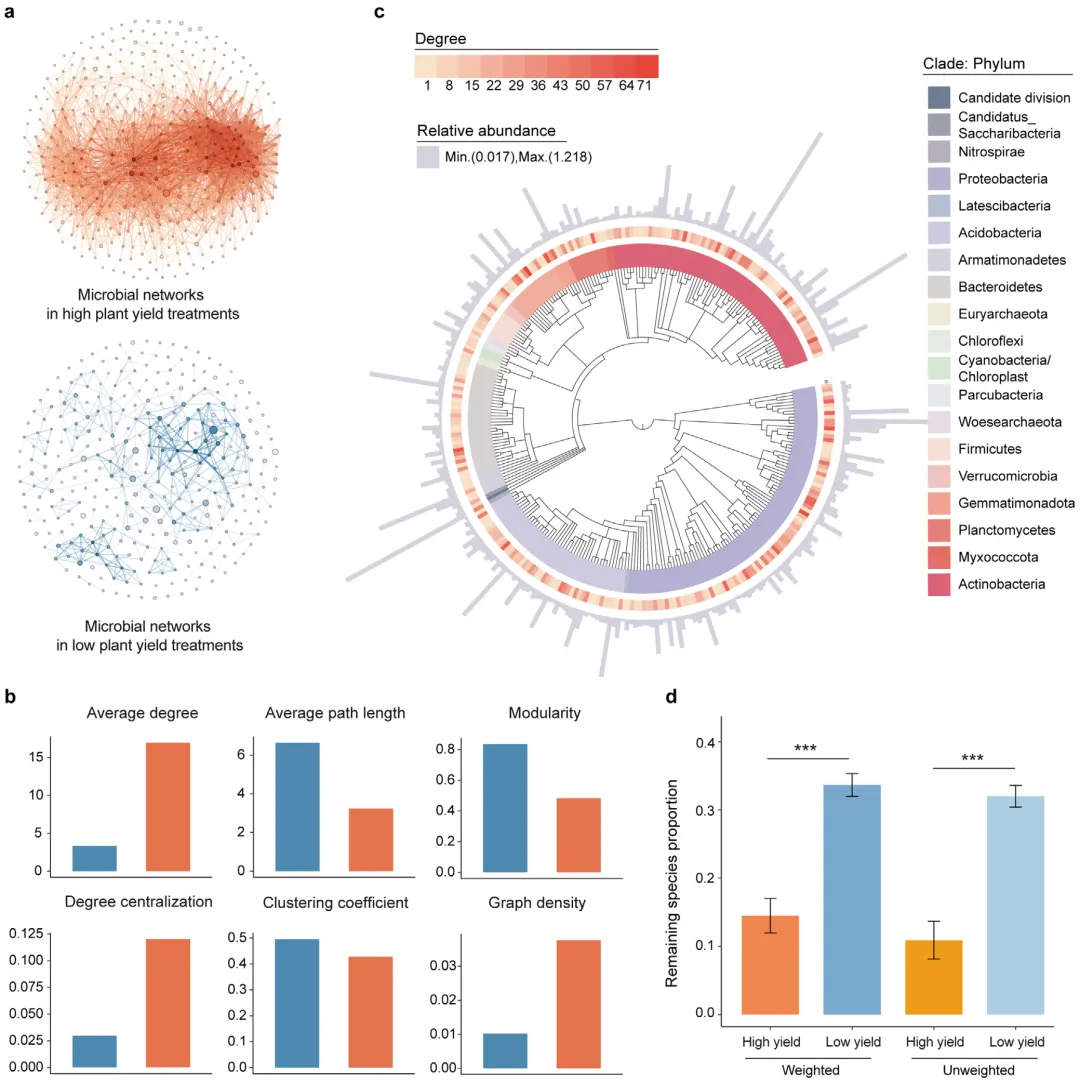
FIGURE 4 | Microbial co-occurrence network structure, topological parameters, and phylogenetic tree of core taxon characteristics in high vs. low plant yield treatments. (a) High and low plant yield treatment microbial co-occurrence networks. (b) Topological parameters of microbial cooccurrence networks in high and low plant yield treatments, including average degree, average path length, modularity, degree centralization, clustering coefficient, and graph density. (c) Phylogenetic tree distribution of core microbial taxa in the network. Different colors represent different phylum-level taxa. The heatmap indicates the connectivity magnitude of different phyla. The bar chart denotes the relative abundance of different phyla. The maximum value is 1.218, and the minimum value is 0.017. (d) The robustness of networks in the upregulated group and downregulated group, with weighted networks accounting for species abundance and unweighted networks not considering species abundance. Bars represent the mean proportion of remaining species across 100 replicate simulations, with error bars showing standard deviation (SD). Significance was determined by two-sample t-tests (***p<0.001).
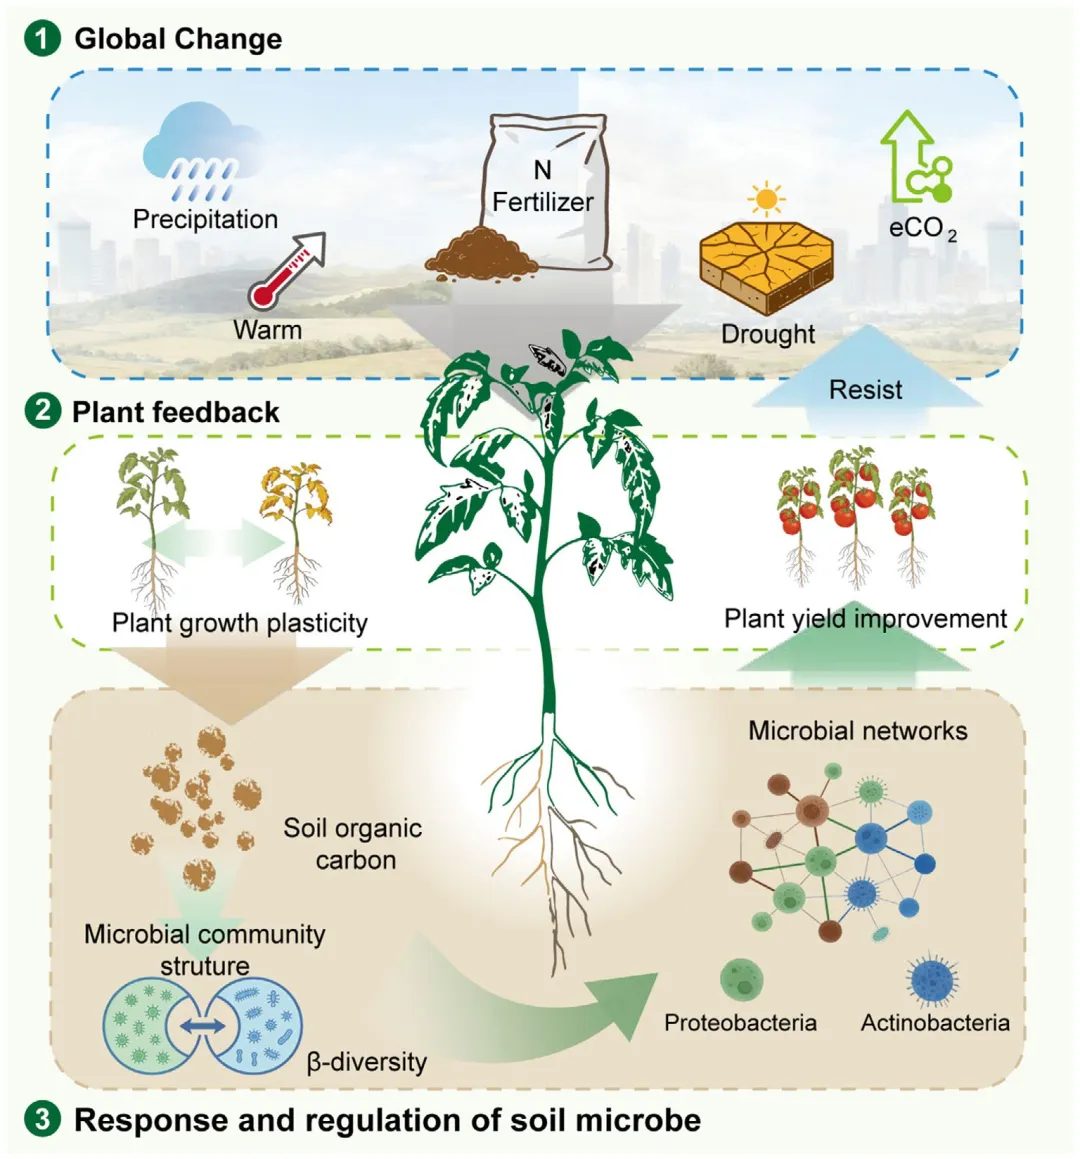
FIGURE 5 | Conceptual diagram illustrating the mechanisms of plant–microbe–soil feedbacks regulating ecosystem functions under global change.