南京林业大学张金池教授团队高被引Nature Ecology & Evolution论文揭示微生物接种剂对土壤微生物群落生物量和多样性的影响!
欢迎点击上方名片关注!推送等相关事宜直接后台私信即可!生物接种是指将微生物从其自然生境移植到新的植物或土壤中,以提高植物性能,这一方法正越来越多地应用于农业和生态恢复。然而,微生物接种剂可能会入侵并改变原生微生物群落的组成;因此,亟需进行系统性的综合分析,以理解微生物接种剂对原生群落生物量、多样性、结构及网络复杂性的整体影响。在此,我们基于335项研究开展了一项Meta分析,结果表明微生物接种剂对土壤微生物生物量具有显著的正效应。这种正效应在环境胁迫条件下减弱,而在施用肥料和使用本地接种剂时得到增强。尽管微生物接种剂未显著改变微生物多样性,但它们显著改变了土壤微生物群落的结构和细菌组成,降低了细菌网络的复杂性,同时提高了网络稳定性。此外,较高的初始土壤养分水平进一步放大了微生物接种剂对真菌生物量、放线菌生物量、微生物生物量碳和微生物生物量氮的正向影响。总体而言,我们的结果表明微生物接种剂对土壤微生物生物量具有积极作用,同时强调了本地接种剂的优势,以及土壤养分水平和环境胁迫在调控这一过程中的重要作用。
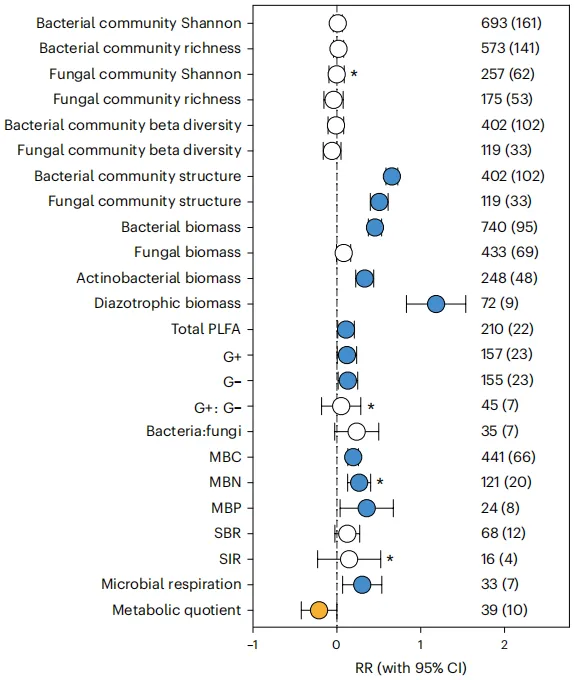
Fig. 1 |The effects of microbial inoculants on soil microbial attributes. Bars around the means denote 95% CIs. Mean values <0 indicate a higher value in the control treatment (yellow dot),while mean values >0 indicate a higher value in the microbial inoculant treatment (blue dots).The number of observations is provided beside each attribute, and the number of publications is indicated in parentheses. Bars with asterisks denote attributes for which publication bias was detected.
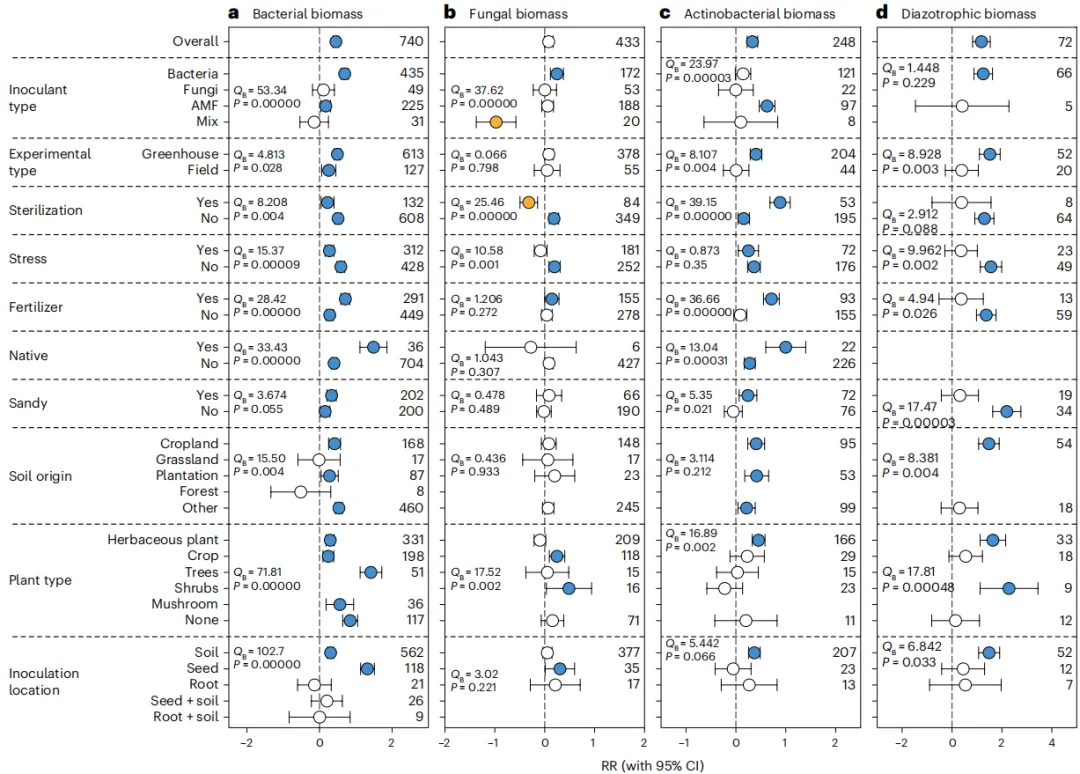
Fig.2 |The effects of microbial inoculants on soil microbial biomass. a, Bacterial biomass;b,fungal biomass;c,actinobacterial biomass;d,diazotrophic biomass. Bars around the means denote 95% CIs. Mean values <0 indicate a higher value in the control treatment (yellow dots),while mean values >0 indicate a higher value in the microbial inoculant treatment (blue dots).The number of observations is provided beside each attribute.The QBstatistic is computed using the one-sided chi-square test.The significance level is set atPrandom< 0.05 to determine the significance of QB. Differences among subgroups are deemed significant when their CIs do not overlap.
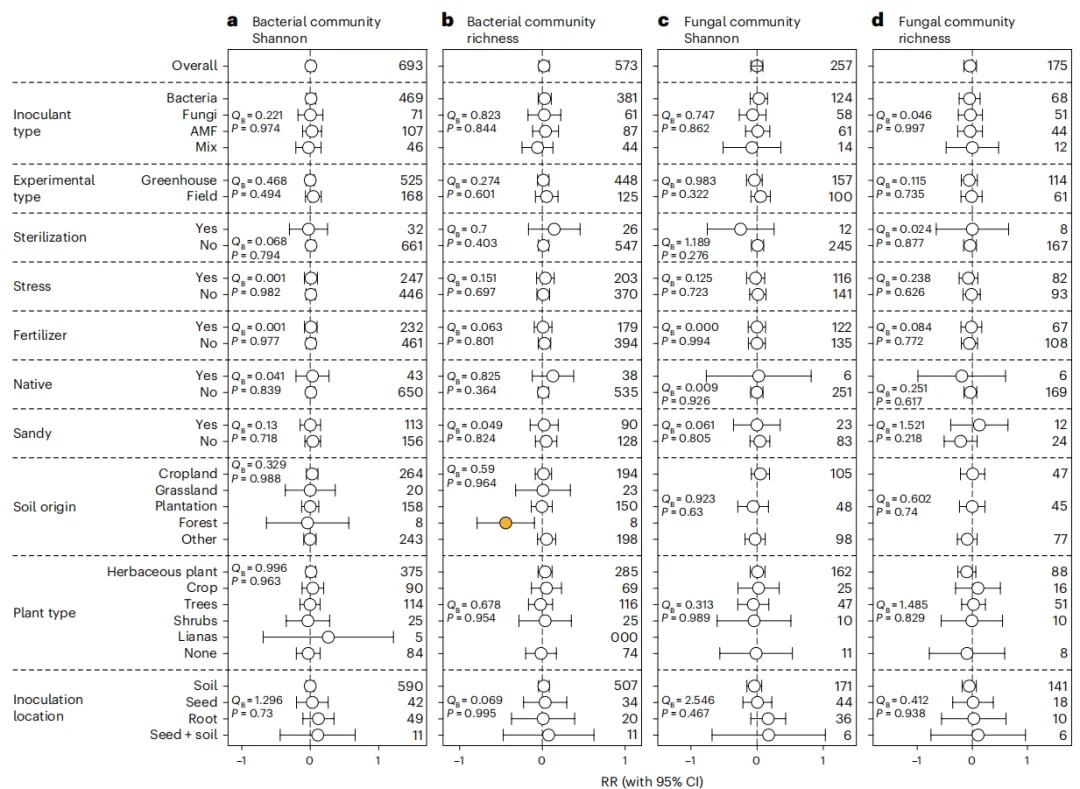
Fig. 3 |The effects of microbial inoculants on soil microbial alpha diversity. a, Bacterial Shannon diversity;b, bacterial richness diversity; c, fungal Shannon diversity; d, fungal richness diversity. Bars around the means denote 95% CIs. Mean values <0 indicate a higher value in the control treatment (yellow dot). The number of observations is provided beside each attribute.The QBstatistic is computed using the one-sided chi-square test.The significance level is set atPrandom< 0.05 to determine the significance of QB. Differences among subgroups are deemed significant when their CIs do not overlap.
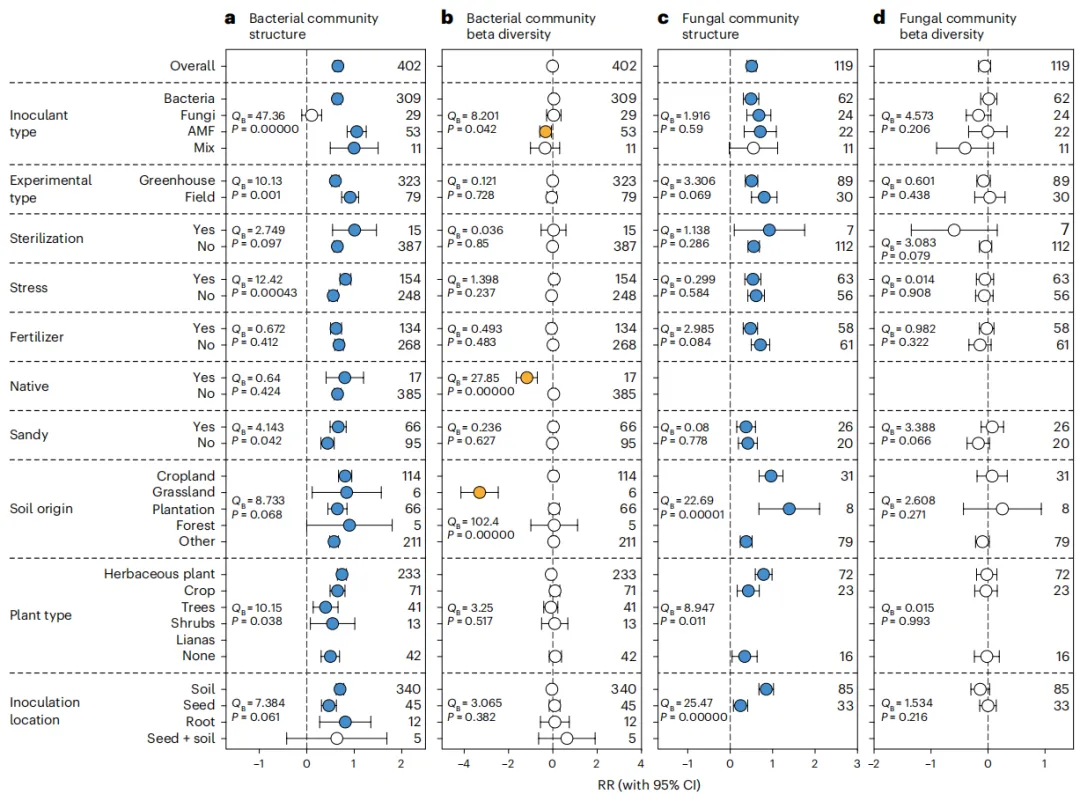
Fig.4 |The effects of microbial inoculants on soil microbial community structure and beta diversity. a, Bacterial community structure;b, bacterial beta diversity; c, fungal community structure; d, fungal beta diversity. Bars around the means denote 95% CIs. Mean values <0 indicate a higher value in the control treatment (yellow dots),while mean values >0 indicate a higher value in the microbial inoculant treatment (blue dots). RRstructure<0 indicates that microbial inoculanthas no effect on microbial community structure, and a greater positive value of RRstructureindicates a greater magnitude of change in the community structure.The number of observations is provided beside each attribute.The QB statistic is computed using the one-sided chi-square test.The significance level is set atPrandom< 0.05 to determine the significance of QB. Differences among subgroups are deemed significant when their CIs do not overlap.
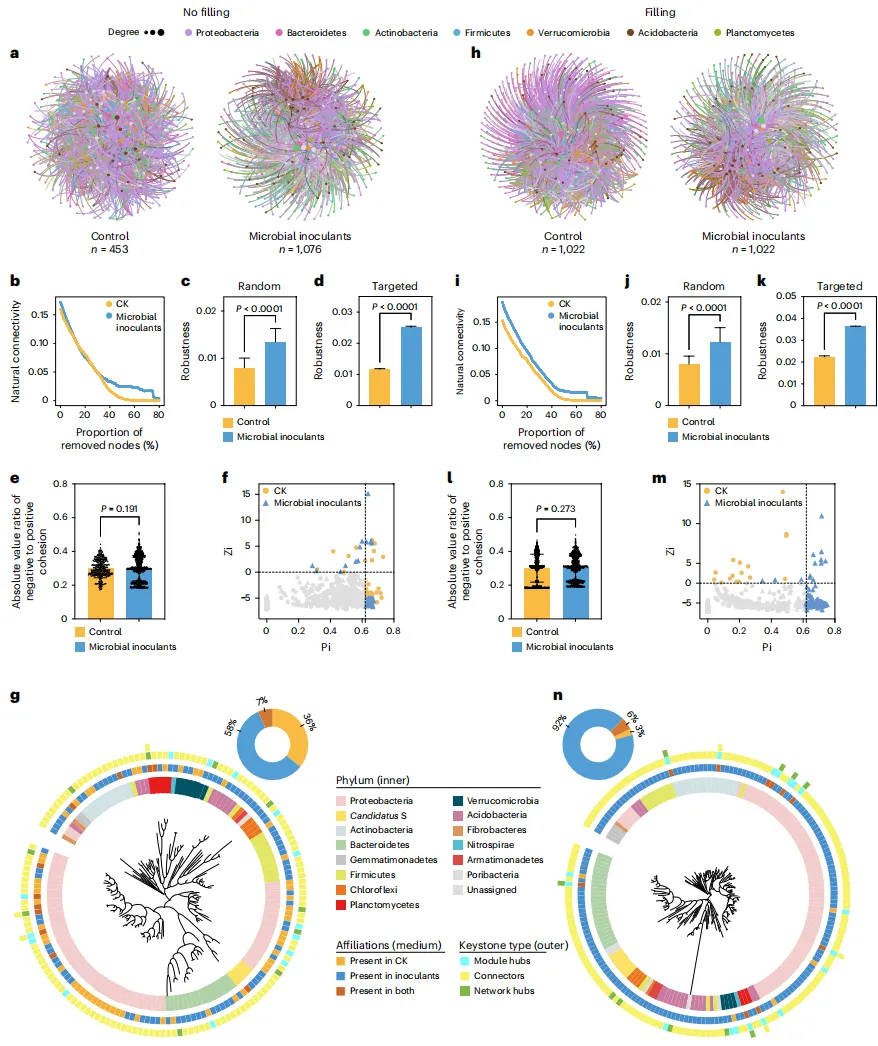
Fig.5 | Global co-occurrence networks of bacterial ASVs in the CK and microbial inoculant treatments. a–g, No-filling data (CK n = 453 versus microbial inoculantn = 1,076). h–n, Filling data (n = 1,022 for both CK and microbial inoculant treatments). a,h, Co-occurrence network.b,i, Natural connectivity of bacterial co-occurrence networks in CK and microbial inoculant treatments, as determined by sequentially removing 80% of nodes sorted by betweenness centrality. c,j,The robustness of bacterial co-occurrence networks, measured as the proportion of taxa remaining after 50% of taxa are randomly removed from each network. d,k,The robustness of bacterial co-occurrence networks, measured as the proportion of taxa remaining after four module hubs are removed from each network. e,l, Network stability of bacterial co-occurrence networks,which was assessed by the absolute value ratio of negative to positive cohesion.f,m, Classification of nodes to identify the keystone ASVs in the networks.g,n,The phylogenetic tree of keystone ASVs in the networks. Inc, d,j and k, each error bar corresponds to the s.d. of 100 simulation repetitions (twotailed t-test). In e, data arepresented as mean ± s.d. (CK n = 453 versus microbial inoculantn = 1,076,two-tailed Wilcoxon’s rank sum tests). In l, data arepresented as mean ± s.d. (n = 1,022 for both CK and microbial inoculant treatments,twotailed Wilcoxon’s rank sum tests).P values are adjusted using the Benjamini – Hochberg FDR correction. Ing and n,the colour of the inner ring represents the taxonomy at the phylum level.The medium ring illustrates the affiliation of keystone ASVs.The outer ring represents the type of keystone ASVs. If the outer ring contains two types,the inner circle represents the keystone type in the CK treatment and the outer circle represents the keystone type in the microbial inoculant treatment. Candidatus S represents Candidatus Saccharibacteria.